The Sunairio Method for Solar Production Risk Assessment

Solar production risk assessment is traditionally based on hypothetical power generation on Typical Meteorological Years (TMYs) or historical weather data. These approaches ignore climate trends and extrapolate from small datasets, leading to production estimates that are unreliable and drift from reality over time. Sunairio addresses these shortcomings via a system of stochastic climate simulations to create arbitrary amounts of realistic local- climate-adjusted weather data.

On 100 representative US solar sites, we first verified that the Sunairio simulation method generated realistic weather. We then found TMYs to be unrepresentative and to overpredict power generation at 85% of the sites. We found site-dependent local-climate-trend production adjustments to range from -6.16% to 2.77% of predicted production in 2022 — adjustments that grew in magnitude to -13.48% to 4.63% when extrapolated out to 2034. An overall negative GHI trend of −0.225 W/m² per year (83% of the sites had negative GHI trends) caused overall production losses of 2.43% in 2022 and 4.98% in 2034 with respect to TMY estimates. Finally, the degree of uncertainty in production estimates was at least four times lower in the Sunairio simulation data compared to production estimates using historical samples.

DOWNLOAD THE WHITE PAPER

Sunairio Method for Solar Production Risk Assessment Form

Northwestern Industrial Engineering Client Project

Check out the latest contributors to Sunairio's tech: Nick, Natalie, Kim, Katie and Gabe--engineering students at Northwestern University who just finished their junior year. Sunairio sponsored a student project (IEMS 394) and asked this team to help us understand wind turbine icing dynamics in real life. Icing events can be catastrophic for wind farm energy production--and they're really hard to predict. But now we have a probabilistic wind turbine icing model that quantifies the risk of these events (in terms of probability of capacity factor loss) as a function of weather. All thanks to the hard work of this Northwestern University engineering student team!

Case Study: Net demand simulation

This case study presents the underlying motivation and representative insights from an electric cooperative net demand planning exercise that utilized a long-term (15-year) correlated climate simulation and machine learning-based energy resource modeling. The approach described here overcomes several challenges related to net demand planning and resource adequacy analysis, namely– 1) the creation of a large sample of properly jointly distributed weather, 2) the incorporation of climate change trends, 3) the creation of a typical hourly net demand path, and 4) the creation (and curation) of extreme–but realistic–weather and energy scenarios across a utility footprint.

DOWNLOAD THE CASE STUDY

HCE Case Study Download Form

Case Study: Reduce annual revenue risk by 24%

Leeward Renewable Energy logo

Leeward Renewable Energy used the Sunairio platform to select new wind and solar projects that best diversified risks across different regions and different technologies. Sunairio enabled Leeward to simulate thousands of correlated future production and revenue outcomes at dozens of current and prospective sites. The Sunairio platform applied modern portfolio theory to pick an optimal combination of new projects.

DOWNLOAD THE CASE STUDY

Case Study Download Form

Understanding variable generation risk

Sometimes the interactions between renewable energy and energy markets are so complex that it’s helpful to simplify the dynamics with relatable analogies. So for this blog post we’re going to start by telling a story about a wheat farm instead of a wind or solar farm. And in doing so we’ll expose one of the most important but subtle risks to utility-scale renewable energy asset profitability. 

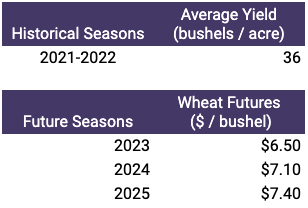
Our story begins with a hypothetical wheat farm investor who is evaluating the purchase of a 100 acre wheat farm. The wheat farm investor is presented with some historical data of average crop yield for similar farmland and the current wheat futures prices. The data shows the following:

historical data of average crop yield

The farmland in question is being offered for a price that implies a $20,000 per year operating cost. Using this data, the farmer constructs a financial model of the wheat farm with two assumptions:

  1. Expected Future Annual Crop Yield = Average Crop Yield from 2012-2022
  2. Expected Future Spot Prices = Current Futures Price
Expected profit for 3 years $15,600

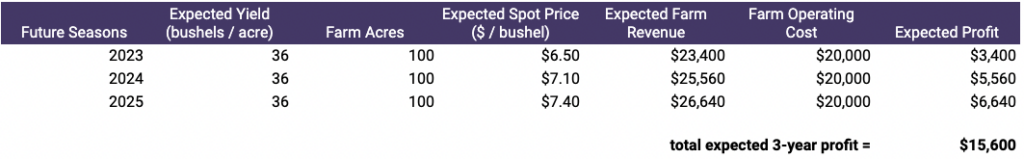
Under these assumptions, this looks like a profitable investment! 

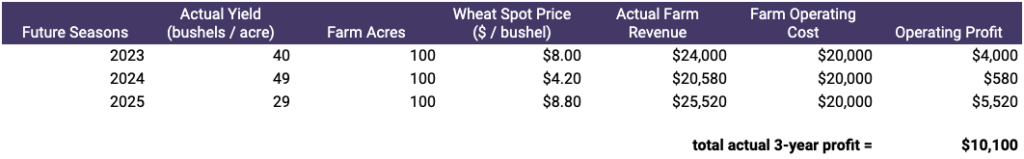
The wheat farmer decides to purchase the farm and grow wheat. Traveling in time to the end of 2025, here’s what happens:

Actual 3-year profit is $10,100

She made less money than she expected, and she almost lost money in 2024 despite having a bumper crop. This happened because everybody else growing wheat had a bumper crop in 2024 as well, which negatively affected market prices due to supply and demand balances. Furthermore, when her crops suffered and she underproduced in 2023 and 2025, everybody else did, too. This caused supply to drop and market prices to rise relative to the expected price from the futures contract. 

Perhaps most surprisingly, the quantity and price outcomes were equivalent to expectations when looking at a multi-year average:

Expected yield and actual average crop yield match and futures price average and actual average spot price match.

The average crop yield over the three year period matches the historical crop yield average, and the average spot price of the three year period matches the average of the futures prices when she bought the farm. Her assumptions of expected yield and price over the three year period were correct.

However, the farm realized lower revenue than expected because of the relationship between seasonal yield and prices: in good growing seasons when there’s a bumper crop, the farmer has more wheat to sell, but at low prices. On the other hand, during poor growing seasons prices are higher because supply is low–but in those seasons the farm brings less crop to market. This negative correlation between yield and price– and the variability between each market phase–eats away at the farm’s profitability.

It turns out that wind farm and solar farm owners experience the same phenomenon in energy markets, except that the comparable “season” in energy markets occurs (at least) every hour when wind or solar energy is generated and energy prices are set by the grid operator. 

For example, a merchant wind farm owner might naively think that high wind hours are great for their asset, while low wind hours are worse. This could be the case…unless the wind farm’s generation is highly correlated with the generation from a lot of other wind farms. In that case, when it’s blowing a lot at one farm…it’s probably blowing a lot at other wind farms, leading to excess regional wind generation and low spot prices. 

What this means is that using expected generation levels and expected price levels to value the variable energy from wind farms and solar farms leads to overestimates of actual project revenues. 

We’ve heard this concept referred to by a number of names including variable generation risk (VGR) and cannibalization. Regardless of what we call it, it can be a major problem for renewable energy investors (who realize lower revenues compared to pre-construction expectations) and it’s not a trivial thing to predict. In fact it’s not uncommon to come across particularly affected projects that can experience VGR costs of as much as 10% or higher of their annual revenue. Moreover, we expect VGR to change dramatically in markets where installed renewables capacity is increasing significantly. 

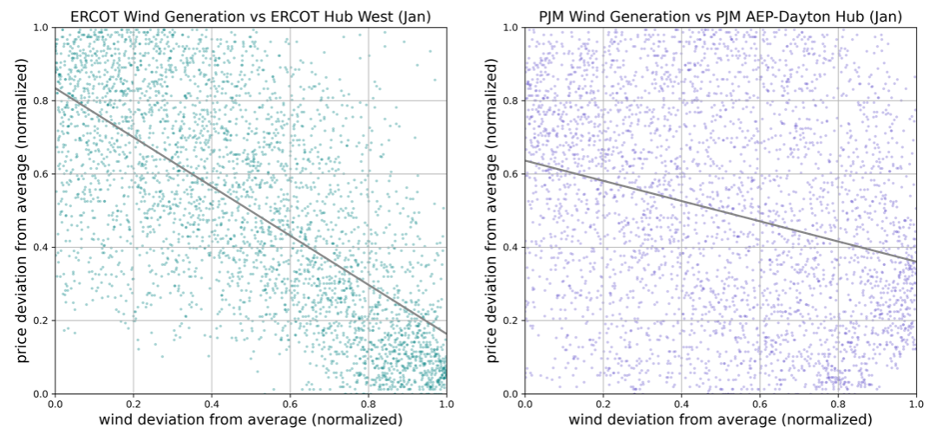
As an example of how this dynamic changes over time as the grid mix changes, here are plots of hourly wind generation levels versus hourly price levels for ERCOT and PJM. For each chart we’ve normalized the wind generation and prices to plot deviations from expected values. You can clearly see this negative relationship is stronger in regions that have a higher share of installed wind capacity than others. (ERCOT > PJM) Over time, these relationships change as the grid mix changes.

ERCOT>PJM

Anyone who’s exposed to quantity and price risk through an investment in renewables needs to be familiar with this concept. Importantly, that also extends to buyers of financial PPAs, such as those being sold to corporates to help underwrite new utility-scale projects. Financial PPA buyers wear this risk and therefore it’s essential for them to understand its effect on future contract settlement ranges and terminal contract value. 

We’ll explore these issues in more detail, including strategies to mitigate these risks, in future posts.

Climate change cost ERCOT over $1b in 2022

Since 1970, Texas has warmed by about 2.9ºF. We wanted to find out how much this has affected electricity demand and prices, so we de-trended 2022 temperatures back to 1970 levels and then simulated hourly load and hourly prices for all load zones in ERCOT.

For this exercise, the amount of renewables stayed exactly the same. The only grid resource we altered was hourly zonal load. To figure out the effect on prices, we applied the 2022 relationships between grid balances and price deviations to the adjusted grid balances and 2022 settled prices.

The result? Lower demand (and prices) in winter but larger demand and price increases in summer that cause a net $1.23 billion total system cost increase.

Temperature warming by US county

Global warming isn’t happening evenly, and some areas are much more affected than others. We wanted to find out more, so we leveraged our historical data and tracked the warming rate by US county. What we found was pretty interesting. Note the faster warming in the Desert Southwest and the overall slower pace in the East—two trends that are also consistent with greater drought (Southwest) and more precipitation (East).

We measured the trend over the 1970-2022 period. We chose 1970 as the starting point consistent with the beginning of the current warming regime documented by the Intergovernmental Panel on Climate Change (IPCC).

The chart is interactive—click to find your county!

Modeling reliability in the energy transition

Summer 2022: Another day, another headline warning about potential blackouts caused by extreme weather. It’s no surprise, given the unprecedented weather we’re experiencing, the increasing demand due to electrification of homes and cars, and the ever-greater reliance of our grid on intermittent weather resources like the wind and sun. 

These trends pose one of the most difficult problems that electric utilities and grid operators have ever faced: how can they guarantee electrical reliability, 24-hours a day, 365-days a year, as they transition away from controllable sources of power and towards renewables? Moreover, how can they do that when our future climate is nothing like our historical climate? What weather analogues can they look to? What stress-tests can they use to confidently ensure reliability standards? That’s where Sunairio comes in.

At Sunairio, we’ve developed a machine-learning powered weather simulation technology that quantifies the likelihood of extreme events, average events, and everything in between–at probability levels that are orders of magnitude more refined than what’s possible from traditional approaches. 

In addition to being a paradigm shift away from cumbersome and slow physics-based weather models, Sunairio is the first commercial weather analytics solution that’s expressly designed for renewable energy problems. Sunairio’s simulations can be generated for any group of points on Earth, properly correlating multiple weather elements (temperature, wind speed, cloud cover, etc.) at high temporal resolution and long scales–enabling grid planners to accurately quantify the odds of having enough generation to simultaneously meet demand, for every hour of the year, for years into the future.

Don’t rely on an historical weather analysis to understand how the grid of the future will behave. Run thousands of simulations of future weather outcomes and future grid conditions with Sunairio’s technology. Get in touch today to find out more.