
Forecasting the weather-driven energy production of wind and solar farms is critical for understanding the physical impact renewable generators have on the grid: variable power flow dynamics, regional supply-demand balances, and ultimately economic price risk. Yet the renewable generation data that’s typically been available to forecasters and grid modelers has a fundamental flaw: it’s reported after curtailment. That is, when historical renewable generation data is provided from public sources, those data sets report as-generated values that include losses due to curtailment (caused by transmission congestion that limits renewable output).
This means that forecasts designed to predict actual renewable generation are missing the most important piece of the story: the potential generation that could have been produced if not for the congestion – i.e., the true meteorological signal of renewable generation risk.
Today Sunairio is excited to fill this gap by launching hourly Asset-Level Generation Potential Forecasts for every utility-scale wind and solar farm across major ISO power markets, beginning with ERCOT. By combining high-resolution Sunairio ONE weather forecast ensembles with high-fidelity wind and solar farm Sunairio Digital Twins, Asset-level Generation Potential Forecasts provide the purest signal of variable generation-driven price volatility on the grid – from individual generator nodes all the way up to ISO-level aggregates and trading hubs.
Figure 1 provides a sneak peak of what this feature looks like in our platform.
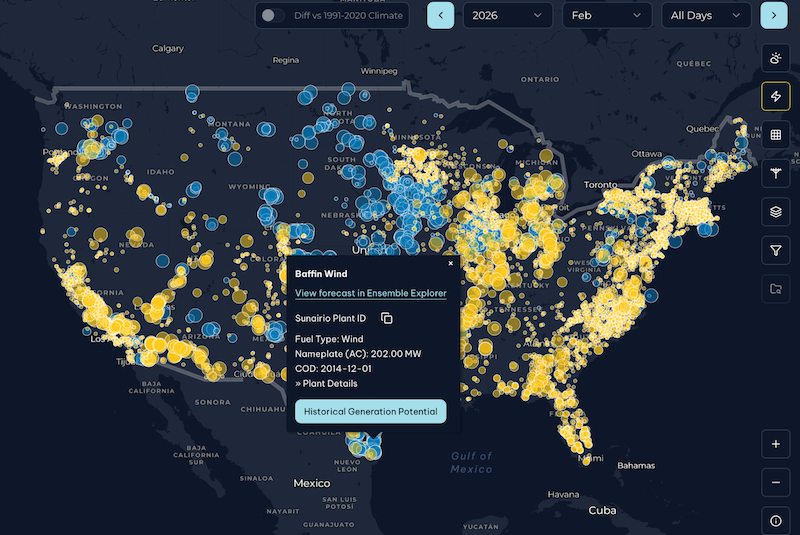
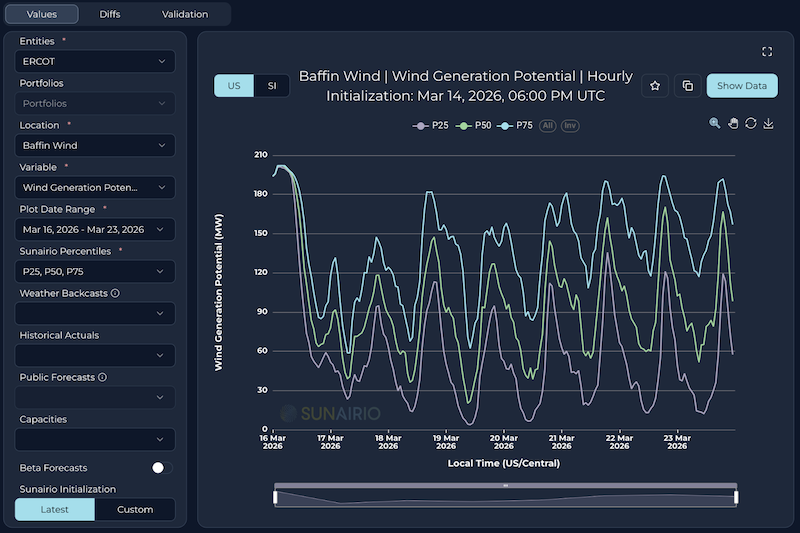
Figure 1. (Left) Map of solar and wind assets in the Sunairio Maps module; (Right) Example wind asset forecast shown in Sunairio Ensemble Explorer module.
The as-generated energy vs. generation potential nuance creates a vexxing problem for anyone trying to understand power market fundamentals. First, it means that we can’t try to replicate past market outcomes by simply using as-generated wind and solar values as inputs to engineering models of the grid – because that actual generation was potentially a curtailed solution of the balancing authority’s dispatch model, not an input to it. Moreover, it means we can’t easily distinguish between A) an hour that had low renewable generation because the wind/solar resource was low and B) an hour that had low renewable generation because the wind/solar resource was so high that it was curtailed due to congestion.
Trying to triangulate the curtailment signal from LMP or raw weather is messy and difficult given the often non-linear relationship between weather and renewable generation. The fundamental signal we want is straightforward: weather-driven hourly renewable generation before curtailment.
Creating Generation Potential starts with building a Sunairio Digital Twin – a high-fidelity physics-based model – of each asset. Sunairio Digital Twins incorporate plant-level technical characteristics (turbine coordinates, hub heights, power curves, PV tracking, PV panel efficiency, etc.) in addition to hyperlocal terrain modeling. For wind, this includes running a 100m-resolution CFD model over the farm footprint to translate mesoscale (3km) wind speed averages into 100m-resolution turbine-scale wind speed fields, and then factoring in turbine-by-turbine waking. For solar, we leverage the best-in-class PVLIB solar modeling suite to replicate asset-specific generation characteristics. These Sunairio Digital Twins already support our existing Historical Generation Potential dataset – covering more than 1,400 utility-scale wind farms and 7,500 utility-scale solar farms – and leverage our market-leading Sunairio High-Resolution Earth Data (SHED) as the source for historical weather.
With the development of Sunairio ONE, we’re now able to provide Generation Potential forecasts, in addition to historical Generation Potential, for all of these renewable sites (Figure 2). By isolating the weather-driven potential from the grid-enforced transmission limits, we enable our users to quantify the volume of energy at risk of curtailment before it happens – and identify high-conviction nodal arbitrage opportunities that post-curtailment forecasts overlook.
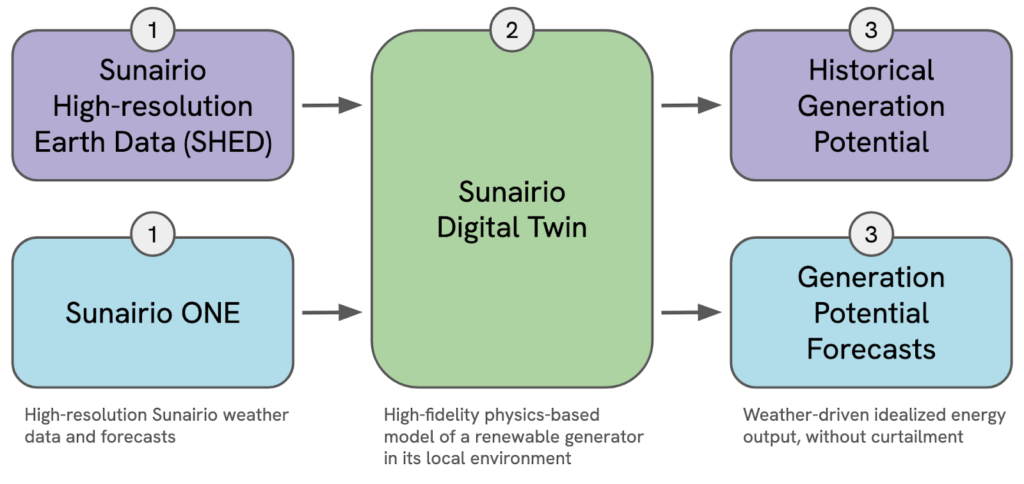
Figure 2. Process of creating Generation Potential given weather inputs and Sunairio Digital Twin model of a wind or solar asset.
We validated our Asset-Level Generation Potential Forecasts against data from IPP partners to confirm how they perform in real-world conditions. For this analysis, we limited our scope to sites that could provide a complete generation picture: hourly availability, hourly curtailment, and hourly net generation. By accounting for availability and adding back curtailment MW we’re able to validate our generation potential forecasts on an apples-to-apples basis.
On a portfolio of three solar sites and six wind sites, Sunairio’s forecast of Generation Potential using same-day and day-ahead weather forecasts achieved scores similar to that of using historical actual weather (Figure 3).
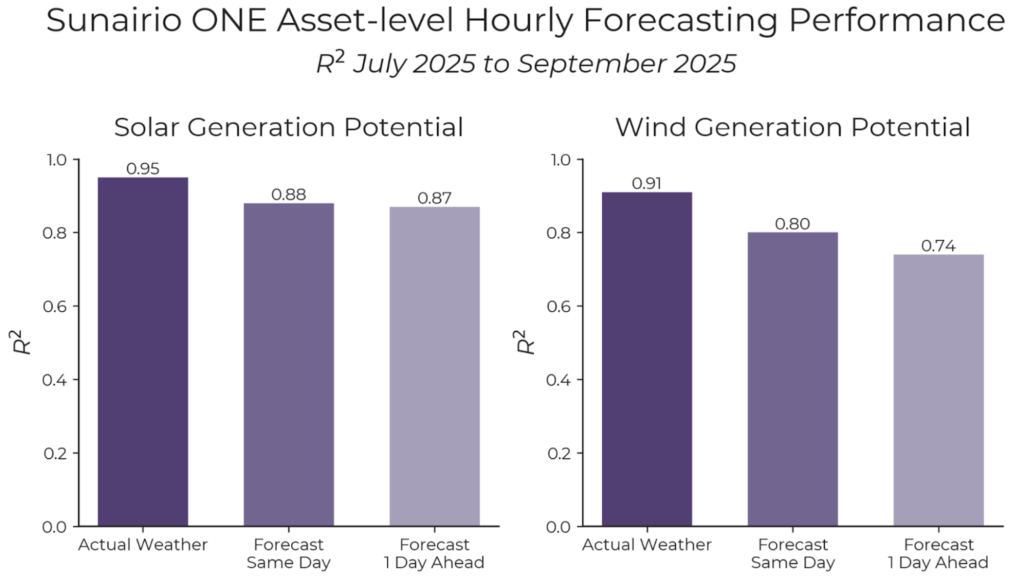
Figure 3. Forecast validation results for a solar portfolio and wind portfolio over three months.
An analysis of the coastal wind farm cluster near the Ajo substation in ERCOT South demonstrates the impact of renewable generation on transmission congestion and highlights the value of Sunairio Generation Potential forecasts for nodal trading.
As shown in Figure 5, five wind farms totaling more than 1,000 MW compete for transmission capacity on the lone path off the coast: the Nelson Sharpe - Rio Hondo line. The Nelson Sharpe - Rio Hondo Generic Transmission Constraint (or NELRIO GTC) in Kennedy County, TX is a notorious bottleneck that ranked as the third most frequently binding constraint in 2025 (Potomac Economics) (Figure 5).
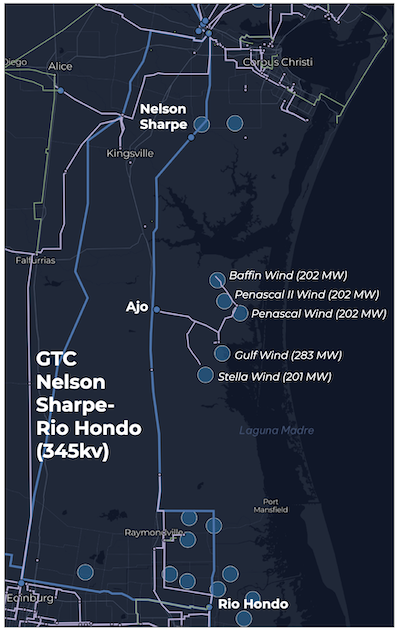
Figure 5. Map of five wind farms and the transmission lines associated with the Nelson Sharp- Rio Hondo Generic Transmission Constraint in ERCOT.
Using Sunairio’s Historical Generation Potential and aligning with three years of historical node and hub LMP data, we can explore the relationship between Generation Potential for this cluster of wind farms and the average node to South hub basis (Figure 6, left). (Note that from 2022 to 2025, the four nodes associated with this cluster of wind farms experience the same real-time LMP in 99.99% of hours.) As the left panel shows, as Generation Potential for that wind farm cluster increases, there is a non-linear shift in the occurrence of more negative local basis.
Traders can visualize this conditional probability of congestion as a surface with Generation Potential (Figure 6, right). Given a Generation Potential of ~900 MW, there is a 90% chance of the LMP basis being less than or equal to -$5, and a 85% chance of it being less than or equal to -$10. For virtuals traders trading into the day ahead market to take on congestion exposure, Sunairio asset-level Generation Potential forecasts are a powerful tool for building optimal bid/offer ladders and accurately quantifying the risk of the resulting trading strategy.
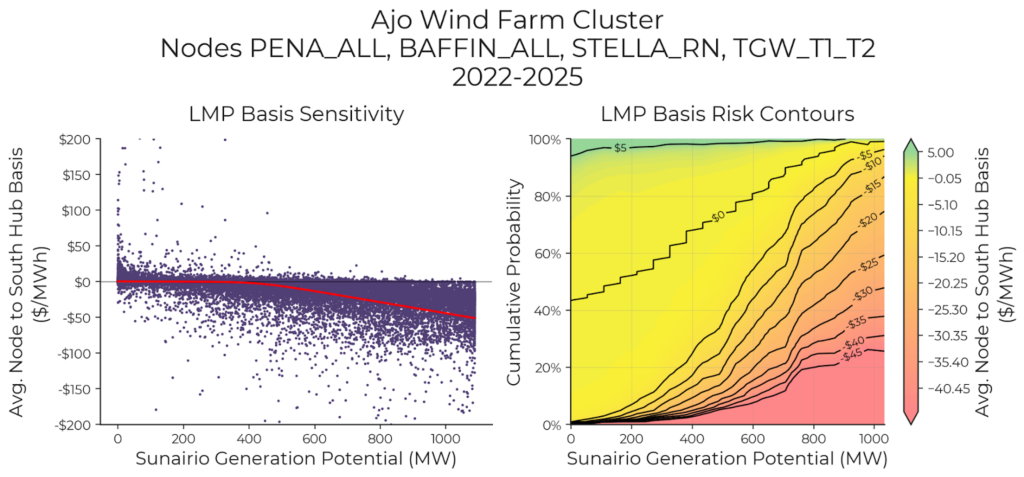
Figure 6. (Left) Sunairio Generation Potential vs. average node basis to South Hub of the five wind farms (2022 to 2025). (Right) Conditional probability of real-time congestion of the nodes associated with the five wind farms.
Asset-level generation potential forecasts aren’t just useful for nodal trading. When aggregated up to load zone or ISO-aggregates, they provide a powerful signal of the regional and market-wide curtailment that’s necessary to balance the grid. For example, Figure 7 shows a strong correlation between total ERCOT West Zone Generation Potential and actual West Zone curtailment, which isn’t visible when looking at Actual (post-curtailed) Generation. Predicting this dynamic via generation potential forecasts is critical for managing zonal basis risk.
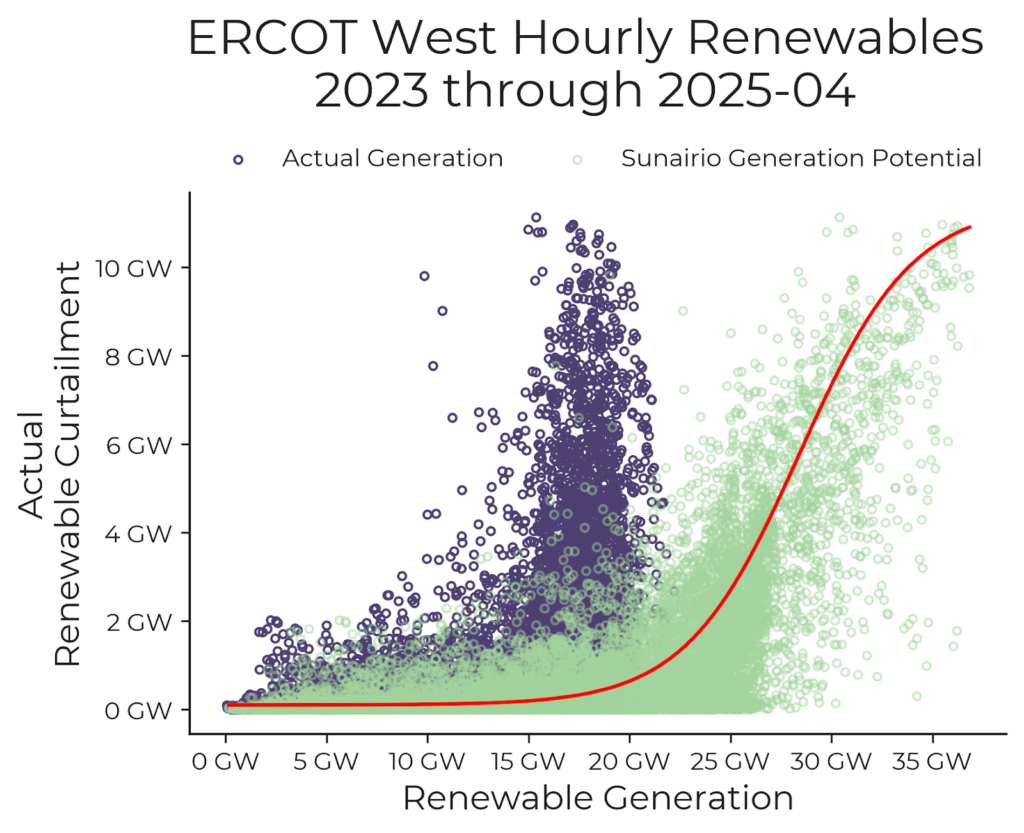
Figure 7. Total ERCOT West Sunairio Generation Potential provides a strong signal of actual total renewable curtailment in the region while actual (post-curtailed) generation completely obscured the relationship
Beyond trading, this granularity is the new baseline for production cost modeling (PCM) and Grid Planning. Our hourly Asset-Level Generation Potential is ideally suited as an input for every individual renewable generation node of SCED models.
Further, Sunairio’s Generation Potential data enable planners to precisely quantify the incremental export capacity required to mitigate regional congestion and validate the specific transmission infrastructure necessary to support it. This shift moves the analytical focus from generalized capacity expansions toward targeted infrastructure investments designed to realize a specific volume of weather-driven energy potential.
The increasing penetration of intermittent renewables and the rising occurrence of unprecedented weather have rendered historical grid performance a diminishingly reliable proxy for future risk. The integration of Sunairio ONE-powered Generation Potential forecasts at the asset level provides the high-fidelity visibility required to navigate a fundamentally decentralized grid.
By reconciling high-resolution weather modeling – including terrain-induced fluid dynamics and advanced irradiance physics – with Digital Twin asset specifications, Sunairio replaces regional approximations with nodal-specific signals. This granularity is essential for quantifying the supply-side volatility that drives congestion, curtailment, and basis risk in modern power markets.Sunairio ONE represents a shift from reactive grid observation to predictive, physics-based intelligence. Want to see the Generation Potential for your most congested nodes? Contact us to run your portfolio through Sunairio ONE.
Potomac Economics. “ERCOT Wholesale Electricity Market Monthly Report.”
https://www.potomaceconomics.com, Potomac Economics, 10 12 2025,
https://www.potomaceconomics.com/wp-content/uploads/2025/12/2025-11_Nodal_Monthly_Report.pdf. Accessed 16 3 2026.