Every trader learns early on in their career that the year is made or lost in a handful of hours. Most days the grid is boring; the few days that aren’t can determine a year’s worth of P&L.
The important hours don’t occur randomly. The biggest price spikes, demand response calls, and moments when the ISO threatens to shed load happen in the hours when the grid is either in an emergency state or close to one. That's when operators are running out of reserves and the normal market rules stop applying.
When a grid operator, the balancing authority responsible for balancing load with supply, can't be sure it has enough generation to serve load and maintain required generation reserve levels, it declares an Energy Emergency Alert (EEA). These NERC-defined events, used by every balancing authority in North America, are summarized in Table 1 below. While EEA levels are defined in the NERC reliability standard EOP 011 (EOP-011-4), each grid operator enacts their own set of operating procedures to meet NERC’s standards.
| Level | NERC definition | Where reserves stand | Market impact |
|---|---|---|---|
| EEA 1 | All available generation resources in use | Operator is concerned about sustaining required contingency reserves | Prices rising toward the offer cap |
| EEA 2 | Load management procedures in effect | Can no longer meet expected energy needs, but still holding minimum contingency reserves | Prices pinned to the offer cap (or beyond due to penalties and congestion) |
| EEA 3 | Firm load interruption imminent or in progress | Unable to meet minimum contingency reserve requirements | Prices at or above cap. Administrative (human) intervention likely. |
Table 1. Summary of NERC EEA levels, definitions, and market impacts
Before issuing the first official alert (EEA 1), each ISO also issues its own pre-emergency warnings, such as weather alerts and conservation appeals. These warnings are based on the grid operator’s early expectations of reserve levels and reflect the operator’s expectation that the grid is tightening.
If reserve level expectations shift even lower, operators issue progressively more serious EEA alerts as a function of the expected reserves and the NERC-mandated minimum reserve levels, culminating in the announcement of EEA 3 actions to manually shed load because the grid simply can no longer keep up with demand.
For most of the past decade, the most severe generation reserve emergencies barely occurred in the Eastern Interconnect. From 2014 through 2025, the six Eastern RTOs together averaged about one capacity-driven EEA 2 episode per year, with no events in 2024 and 2025.
2026 has been different. As of early October, Eastern RTOs have declared five EEA 2 episodes already – more than in any year since at least 2014 (Figure 1). MISO went to EEA 2 on January 24, July 15 and September 2; PJM declared EEA 2 on July 2–3 and again on September 17. Widely-published projections of generation reserve shortages by the end of the decade appear to have underestimated the degree to which the grid has already tightened.
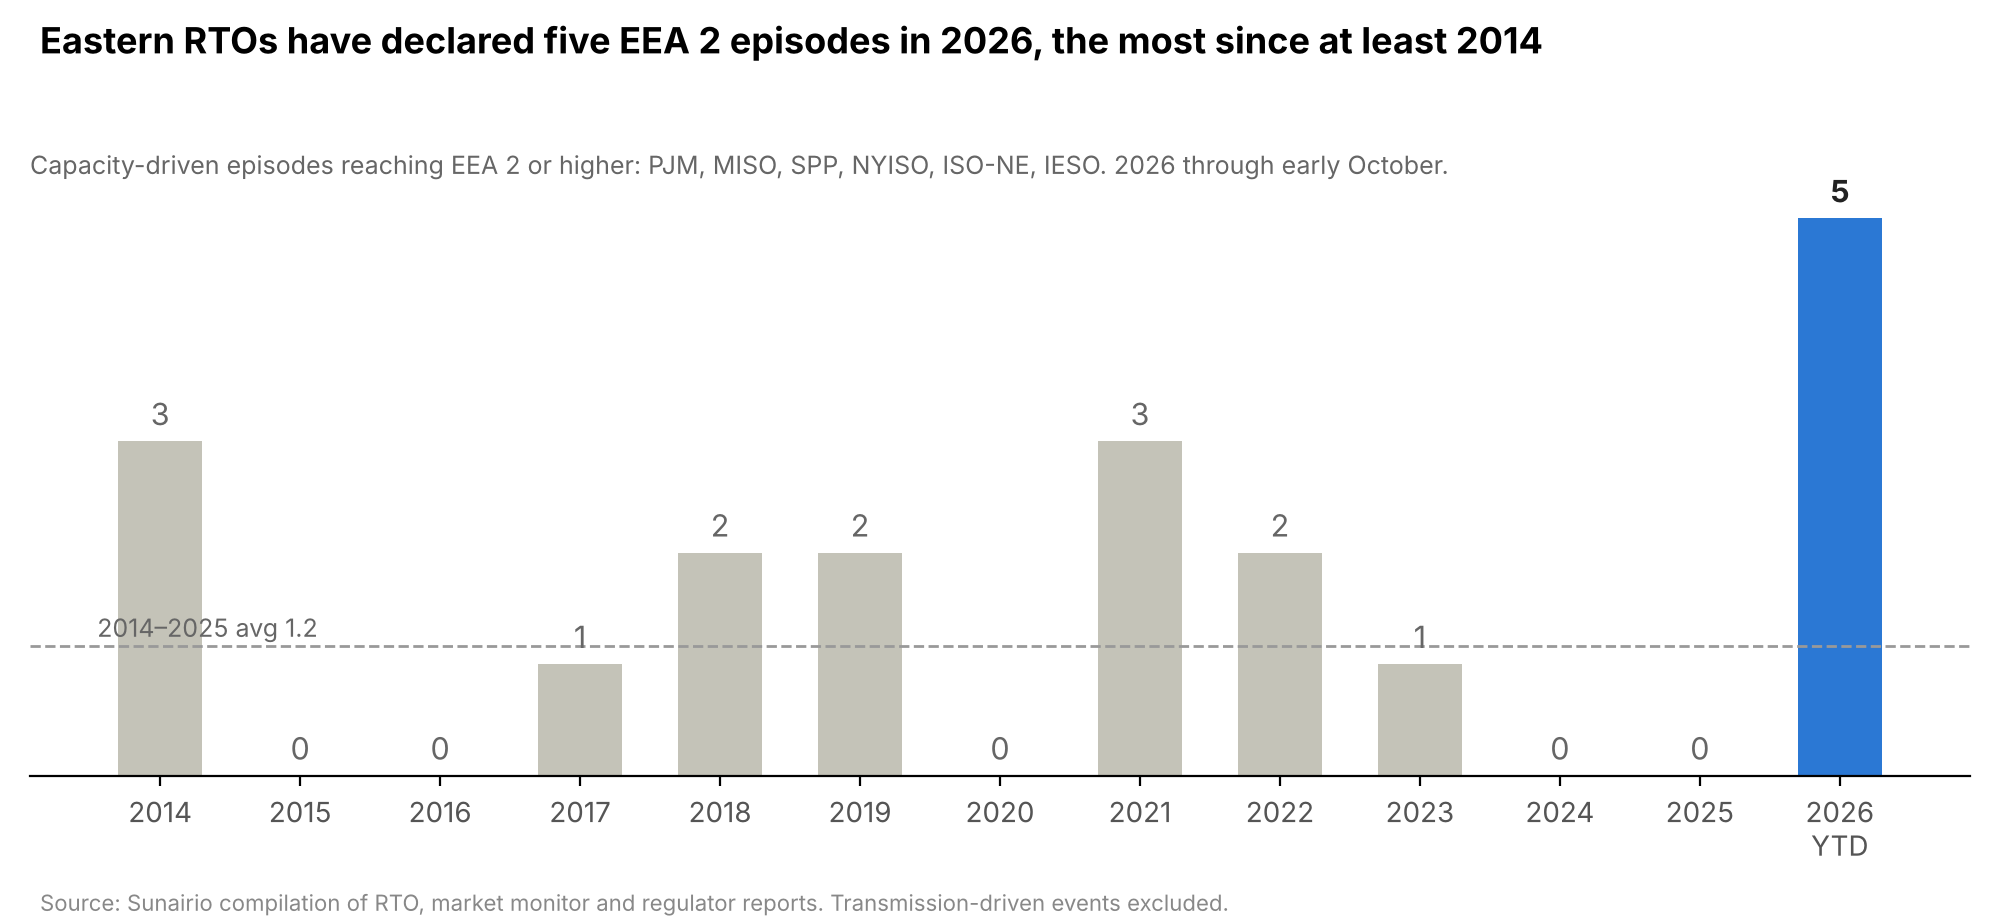
Figure 1: EEA 2+ episodes per year, Eastern RTOs, 2014–2026 YTD. Source: Sunairio compilation of RTO, market monitor and regulator reports; transmission-driven events excluded.
That's why we're launching Emergency Event Forecasts: hourly probabilities of regional supply-scarcity-driven grid emergencies – starting with PJM and ERCOT – to help traders, asset managers, flexibility providers, and investors understand how to anticipate and manage this new normal.
Depending on the stakeholder, the impact of a grid emergency is most keenly felt through high market prices or the very-near possibility of load curtailment.
Data center operators. For large loads, a grid emergency is no longer someone else's problem. On July 2 this year, for example, PJM issued Back-Up Generator Warnings to large loads that they might be forced onto backup generation (i.e., disconnected from the grid). Under PJM's proposed Interim Resource Adequacy Service (IRAS), new loads of 50 MW or more that don't bring their own new capacity would be curtailed before PJM calls pre-emergency demand response. Although FERC rejected this proposal, it indicated that similar procedures could be instituted by state regulators.
Sunairio’s Emergency Event Forecasts responds directly to questions we've heard from data center operators, which no existing forecast yet answers:
Traders. For energy traders, a grid emergency sends the market immediately to a radically different price regime. Once an RTO is short on reserves, shortage pricing takes over, real-time prices pin at the offer cap, and congestion can push some nodes even higher. On September 2, 2026, for example, MISO hit its $10,000/MWh cap during an EEA 1 event. Traditional price forecasting algorithms, which anticipate a smooth curve, struggle with these volatile and discrete regime switches. An emergency event probability is a direct read on when that switch is likely to flip.
As discussed previously, each ISO maps the NERC levels onto its own operating procedures, adding rungs before and within them. We’ve normalized these levels, starting with pre-emergency warnings (Table 2).
| NERC Stage | PJM | ERCOT |
|---|---|---|
| Pre-emergency | Weather Alert; Capacity Advisory | DR pre-emergency curtailment; EEA Watch |
| EEA 1 | EEA 1 Alert; EEA 1 Action (pre-emergency DR) | EEA 1 |
| EEA 2 | EEA 2 Alert; EEA 2 Action (capacity emergency DR); EEA 2 Action (energy-only emergency DR) | EEA 2 |
| EEA 3 | EEA 3 Warning; EEA 3 Action (manual load dump) | EEA 3 |
Table 2: The emergency event ladder.
As the NERC definitions in Table 1 show, emergency declarations are fundamentally driven by anticipated reserve levels. In order to create forecasts of energy emergencies, we need to be able to accurately forecast reserve levels in the hours that matter.
As we show in Figure 2, Sunairio’s proprietary Grid Stress Index (GSI) does this well – GSI is highly correlated to operating reserves in periods of high stress (with negative Pearson’s correlation, i.e. with reserves decreasing as GSI increases). As a reminder, GSI measures dispatchable capacity utilization: how much of the available dispatchable fleet is needed to serve load and is the signal that powers our hub price forecasts.
On ordinary days, GSI and operating reserves are less correlated (correlation = -0.47). Reserves move with unit commitment, imports, and operator choices that say little about system-wide stress. As the grid tightens, though, the relationship snaps into focus. And in the periods that lead to emergencies, GSI and reserves move almost in lockstep (correlation = -0.86).
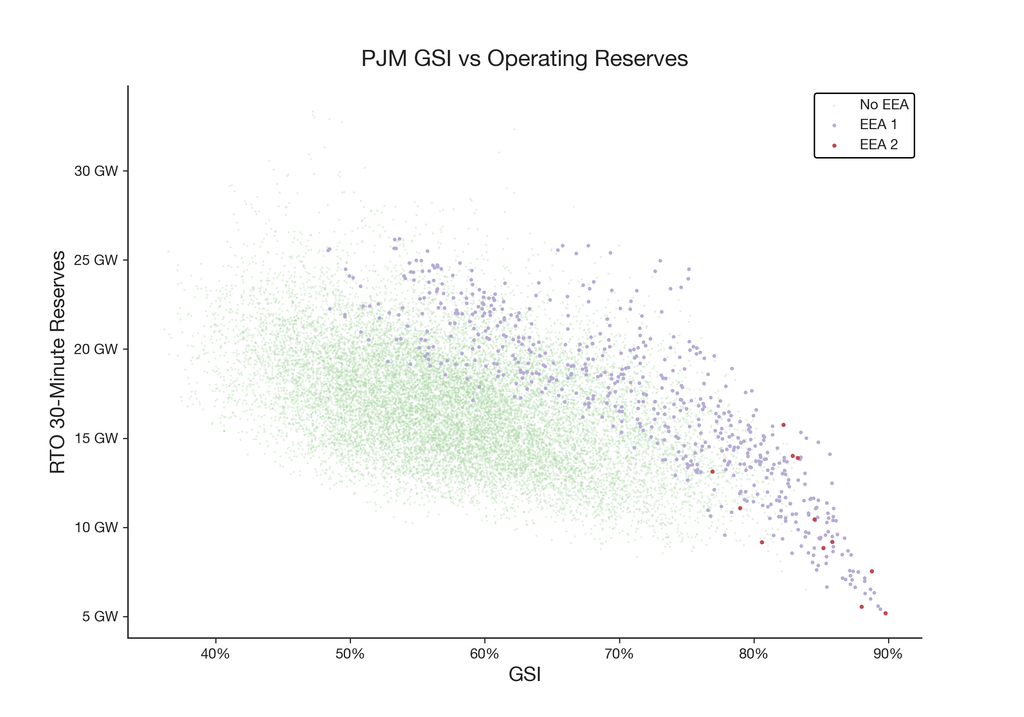
Figure 2: In PJM, while GSI is loosely related to the RTO’s 30-Minute Reserves in general, this relationship is much stronger during times of grid stress (EEA 1 and EEA 2).
A signal that only works when the grid is tight might sound like a limitation, but in reality those are the only hours this forecast needs to get right – and the hours other approaches miss.
Although their frequency is increasing, energy emergencies are still inherently rare. Even 5 daily events in a year across 6 Eastern ISOs only represents a 0.2% daily frequency. To tease out the occurrence of these rare events, our weather-driven ensemble produces 1,000 equally likely paths of hourly GSI for every load zone. We translate every path into a binary (yes/no) hourly forecast of each EEA level and then calculate the overall event likelihood based on the relative frequency within the 1,000-path ensemble.
As each balancing authority establishes their own operating procedures to meet NERC’s requirements, how we translate GSI to EEA events differs by ISO. In ERCOT, emergency levels are tied to explicit reserve thresholds. Therefore, our model follows that physical link. In PJM, on the other hand, operators have discretion over when to declare events. Here, we train machine learning models on PJM's history of emergency declarations in various grid conditions to learn how grid stress turns into actions.
Our forecasts flagged a high likelihood of both of PJM's 2026 events several days in advance.
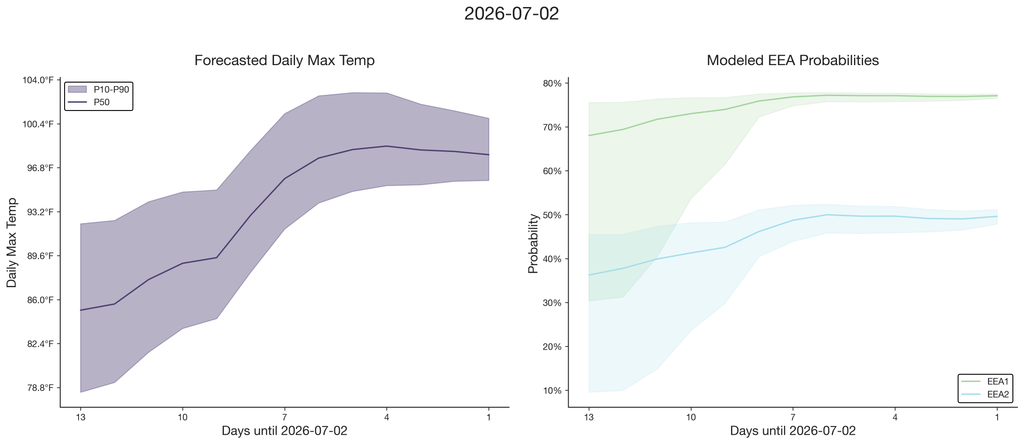
Figure 3: As weather forecasts identify the arrival of a record-setting heat wave in PJM, our Emergency Event Forecast identifies the increasing risk of EEA events a week in advance.
In the days leading up to July 2, weather forecasts identified a record-setting heat wave heading towards PJM. Load forecasts for the daily max soared above 165 GW, leading PJM to eventually declare an EEA 2 RTO-wide, activate emergency demand response, and issue a first-of-its-kind warning that large loads could be disconnected from grid power and forced onto backup generation (PJM). As we see in Figure 3, Sunairio’s Emergency Event Forecast identified the increasing risk of EEA 1 and EEA 2 events with increasing confidence a week in advance.
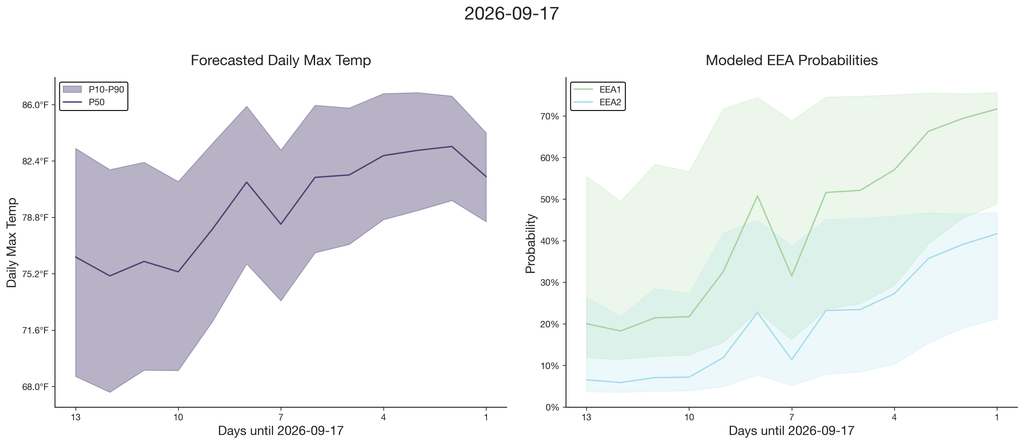
Figure 4: On September 17th, a late heat wave during outage season caused EEA events with relatively modest load. Sunairio’s Emergency Event Forecast takes outages into account and predicts increasing risks of EEA events as the date approaches.
In the days leading up to September 17, another heatwave headed towards the PJM footprint. This heat wave, though it brought milder temperatures than the July heat wave, coincided with generation maintenance and outage season in PJM. With 36 GW of generation offline (PJM) and a peak load forecast of 132 GW, PJM declared another EEA 2, pre-emergency demand response across most of the RTO, and emergency demand response in BGE, Pepco, and Dominion. As we see in Figure 4, our forecasts (which incorporate the effect of outages) predicted the increasing risk of EEA 1 and EEA 2 events well in advance of September 17.
2026 isn't the tightest the grid will get. Our long-range forecasts show PJM emergency events increasing sharply after 2029 as load growth outpaces new supply. In Figure 5, we see that while we are nearly certain to have at least an EEA 1 event in each year, with the chances of having the more severe EEA 2 and EEA 3 events increasing as the grid tightens. Our models, for example, predict a 93.2% chance of an EEA 2 event and a 37.8% chance of an EEA 3 event in 2029.
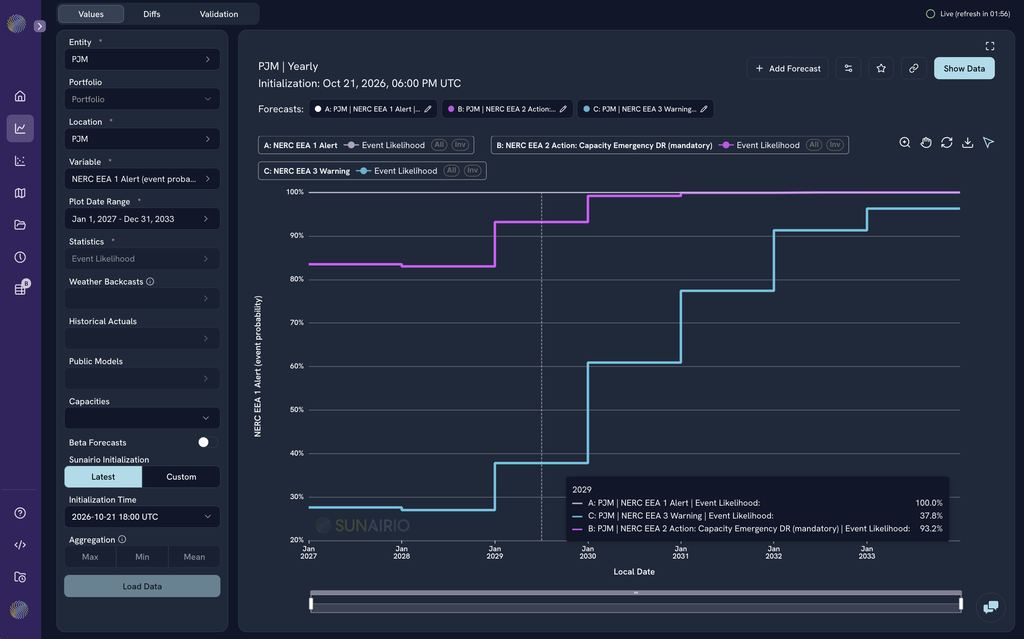
Figure 5: Long-range forecasts of EEA events in PJM. As the grid tightens, the chance of an EEA event in each year goes up.
Zooming into the daily risk profile in 2029 (Figure 6), we see that the Emergency Event risk is primarily concentrated during weekdays in the summer, with some risk from winter storms and late summer heat waves that correspond with shoulder season outages.
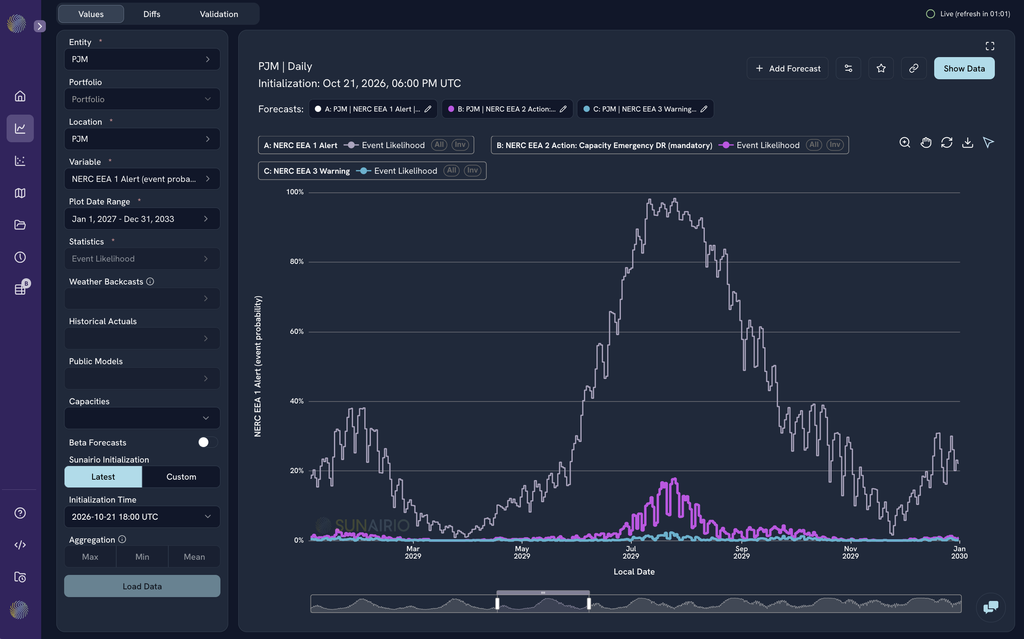
Figure 6: Daily risk of EEA events, according to Sunairio models in 2029. The risk is concentrated in the peak summer months, though the occasional winter storm and heat wave during fall can also cause grid emergencies.
This is consistent with PJM's own outlook. The 2028/29 capacity auction cleared 6.8 GW short of the reliability requirement, and PJM expects system stress to rise through 2031 (POWER).
For a data center operator choosing a site, sizing backup generation, or weighing whether to bring its own capacity under potential IRAS-like regulations, this multi-year outlook of grid emergency risk is critical.
Emergency Event Forecasts are available today in the Sunairio UI and through our API:
How customers use them:
The grid's worst hours used to be so rare that they were mostly ignored. They can’t be anymore. If your business depends on knowing when they're coming, contact us for a demo.
