
Late last month, on June 24, 2025, PJM experienced a record-setting heatwave that sent heat indexes soaring above 100oF throughout the Mid-Atlantic, hotter than anything observed in late June since at least 1950. This extreme weather event sent regional power demand and prices spiking — though not at the same time.
The price spike occurred in the two hours after demand peaked that day — a (perhaps unexpected) consequence of the growing reliance on renewables in PJM. Here's how solar fundamentally changed PJM's risk profile on that sweltering June day.
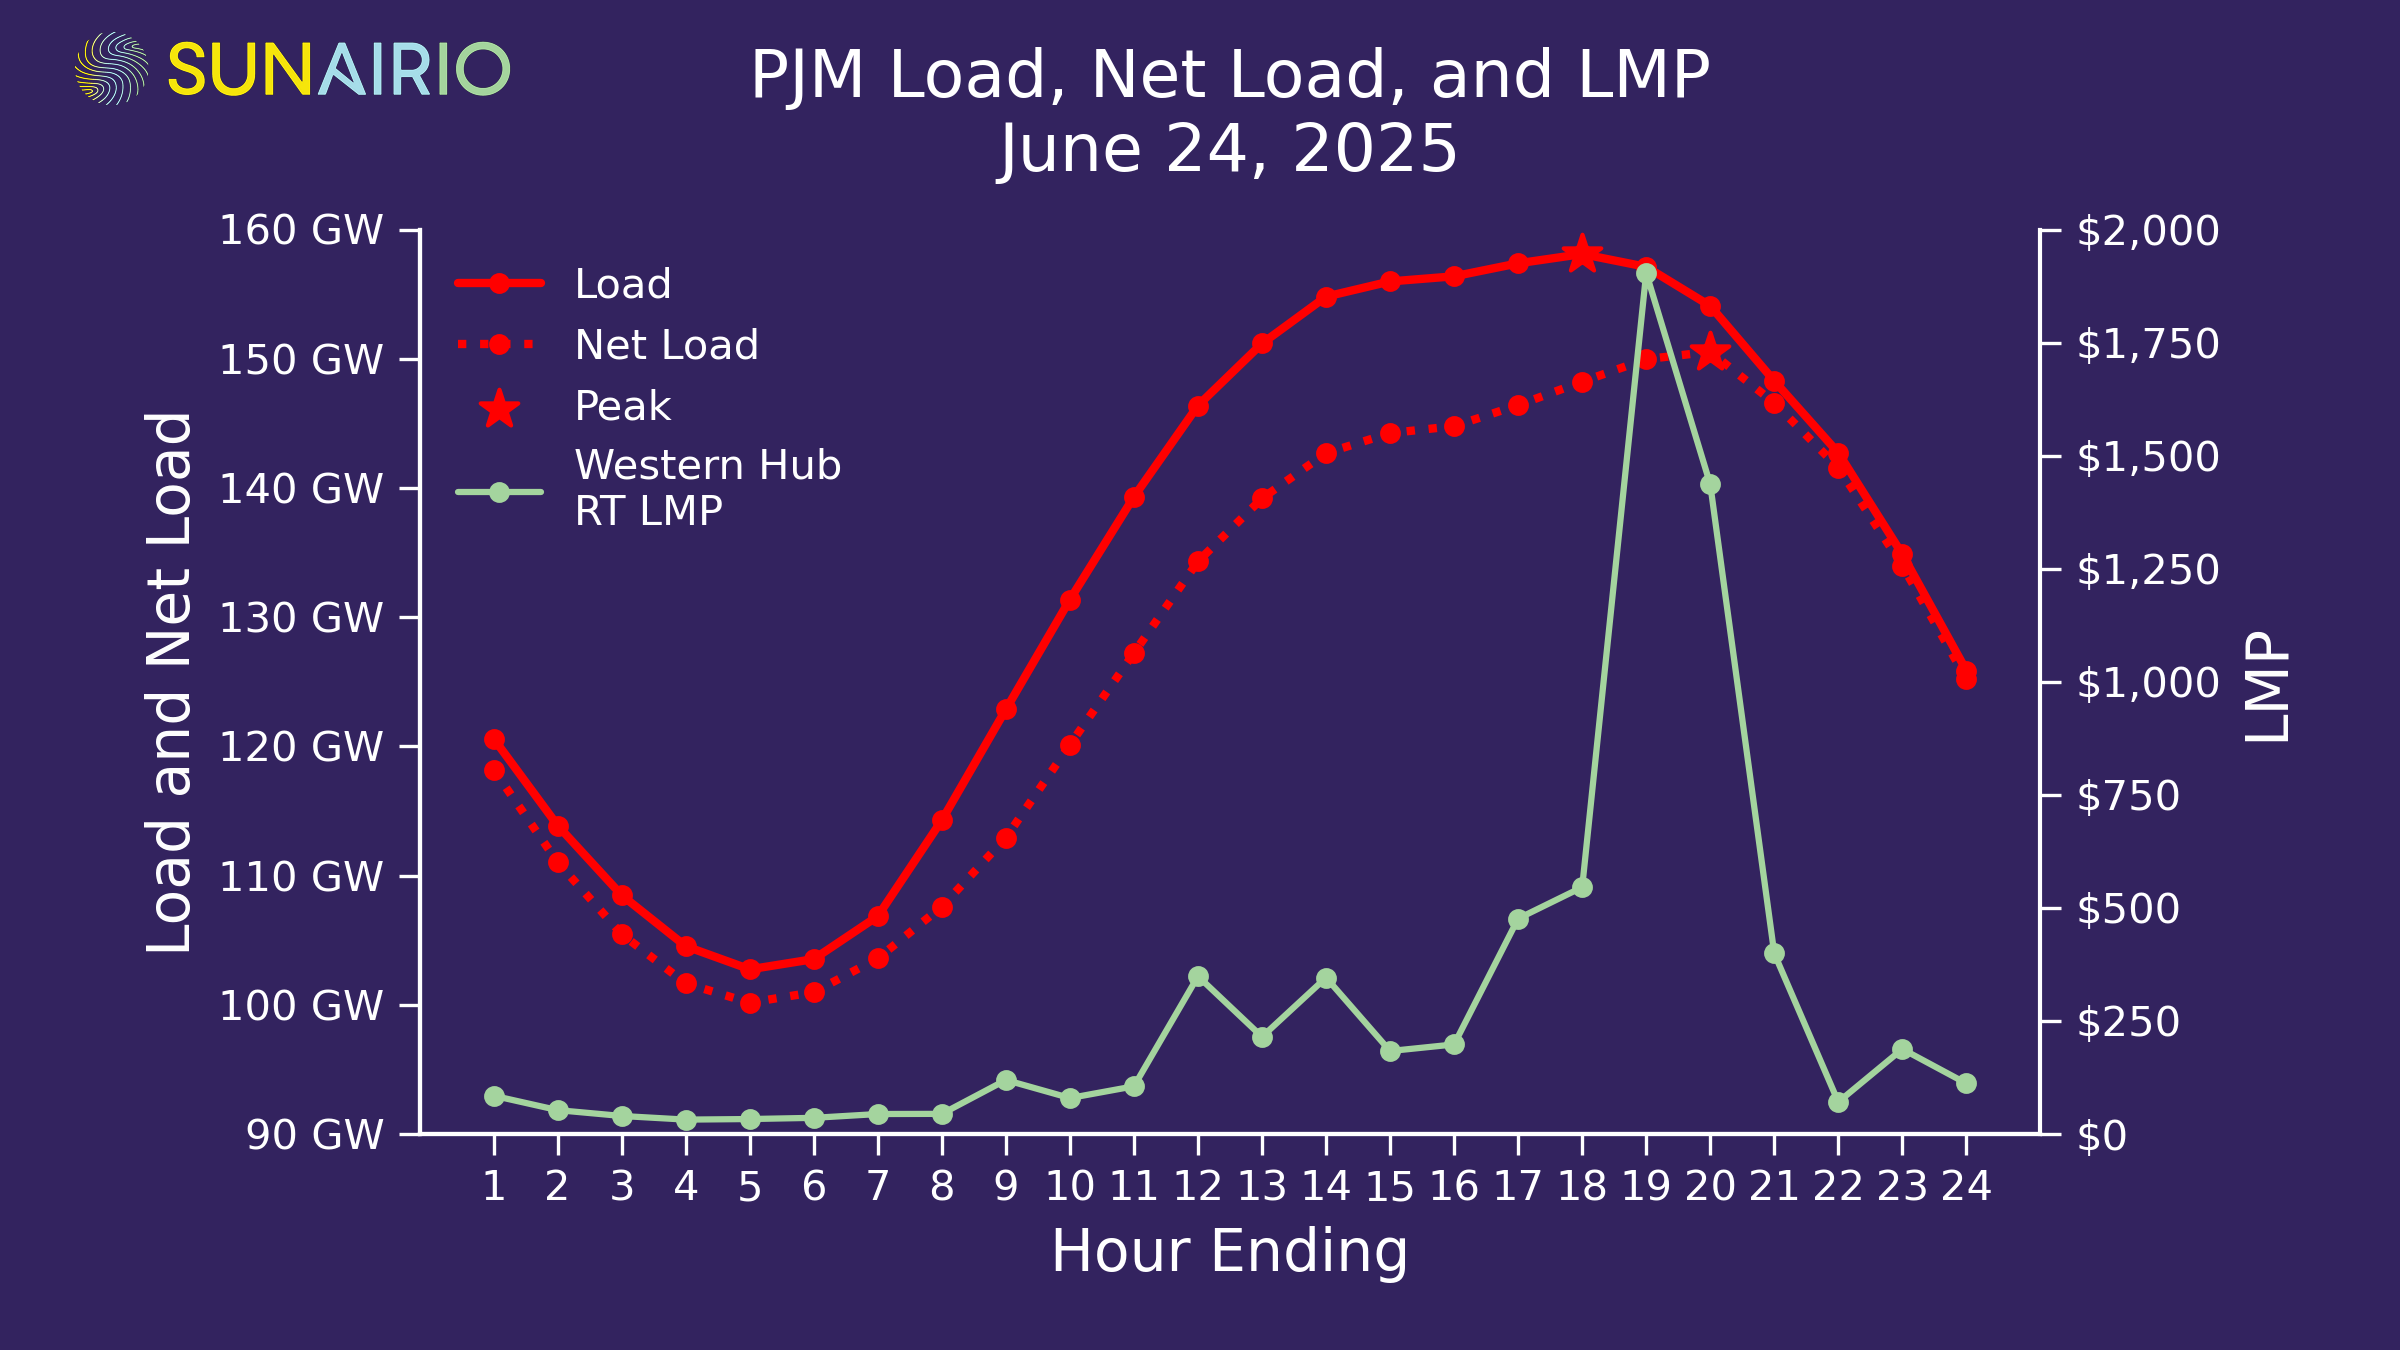
Net load — not native load — drives today’s price spikes. PJM native load peaked in hour ending (HE) 18, but Western Hub LMP spiked to $1,500/MWh+ in subsequent HE 19 and 20, as the plot in Figure 1 shows.
Why? Because those are the hours in which net load peaked. As we’ve discussed before, net load (native load minus renewables) is the primary driver of grid stress in power markets with a significant share of renewables. And when grid stress rises, so do prices.
We can now officially count PJM as a market in which renewables can’t be ignored.
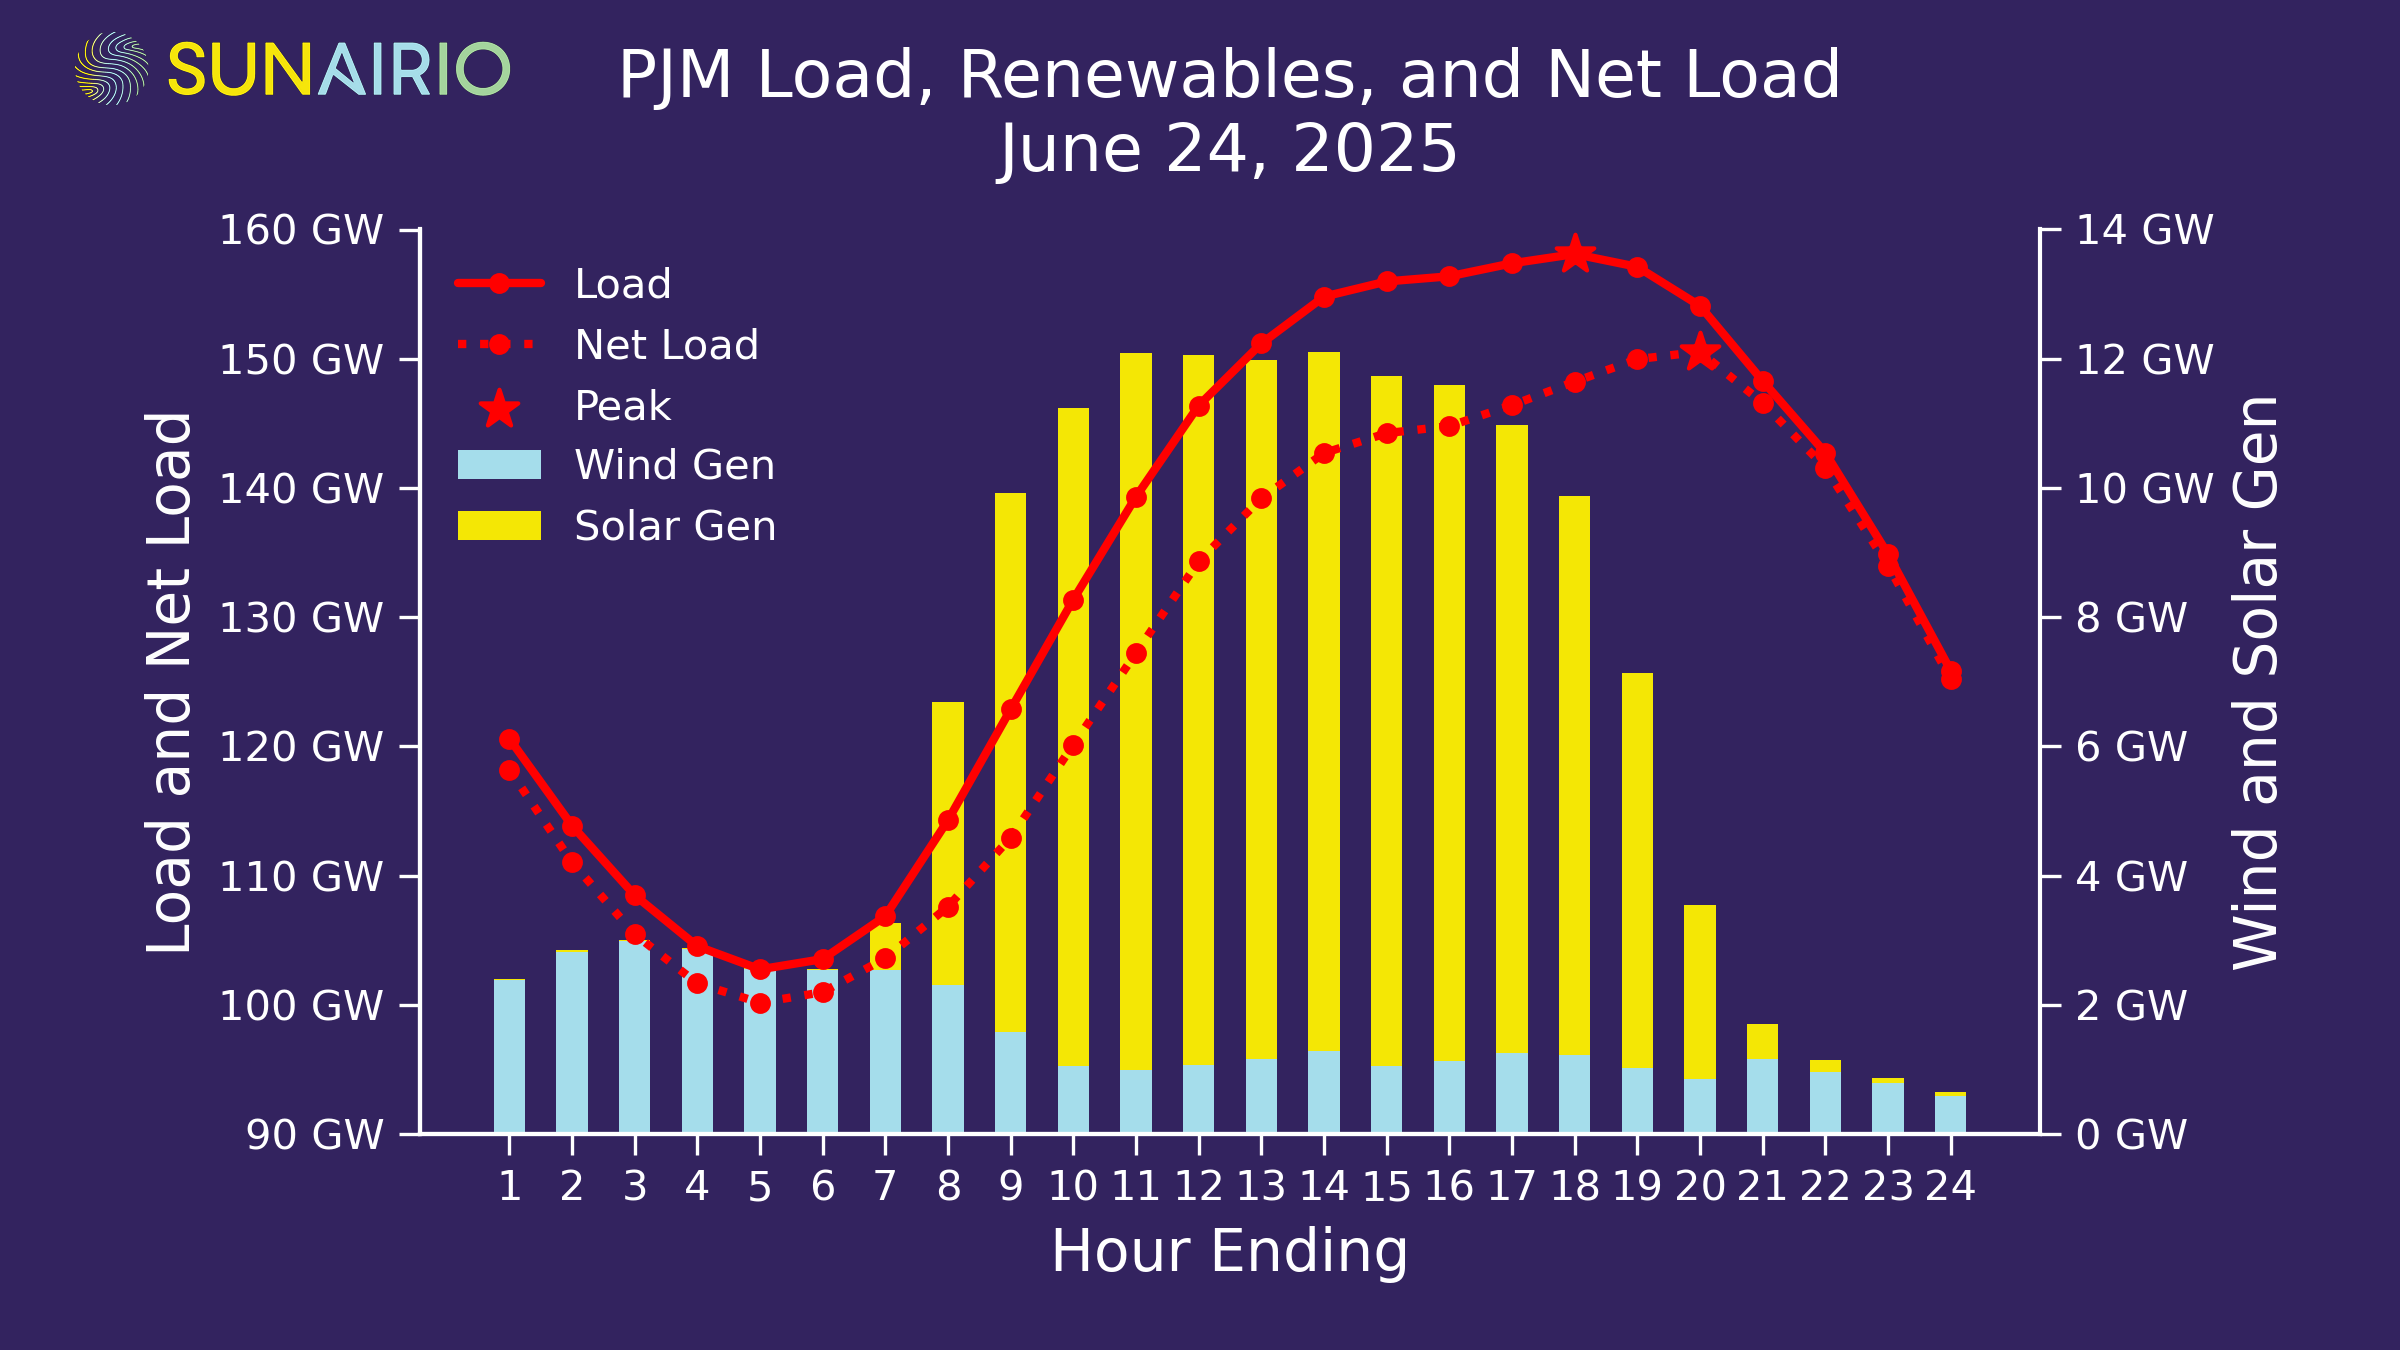
As Figure 2 shows, there was approximately 10 GW of solar generation in PJM on June 24 during hours 10–17, which significantly reduced net load — and therefore grid stress — throughout the day. Even in the peak load hour (HE 18) there was still 9 GW of solar generation.
But this solar output dropped precipitously as the sun set across the ISO footprint to just 3 GW in HE 20 — causing net load (and overall grid stress) to continue to rise even as native load was falling. The resulting net load ramp required PJM to quickly dispatch expensive units to stabilize the grid.
The end result? The highest prices we’ve seen in PJM since 2022 occurred much later in the day than would have been historically expected for this period in June.
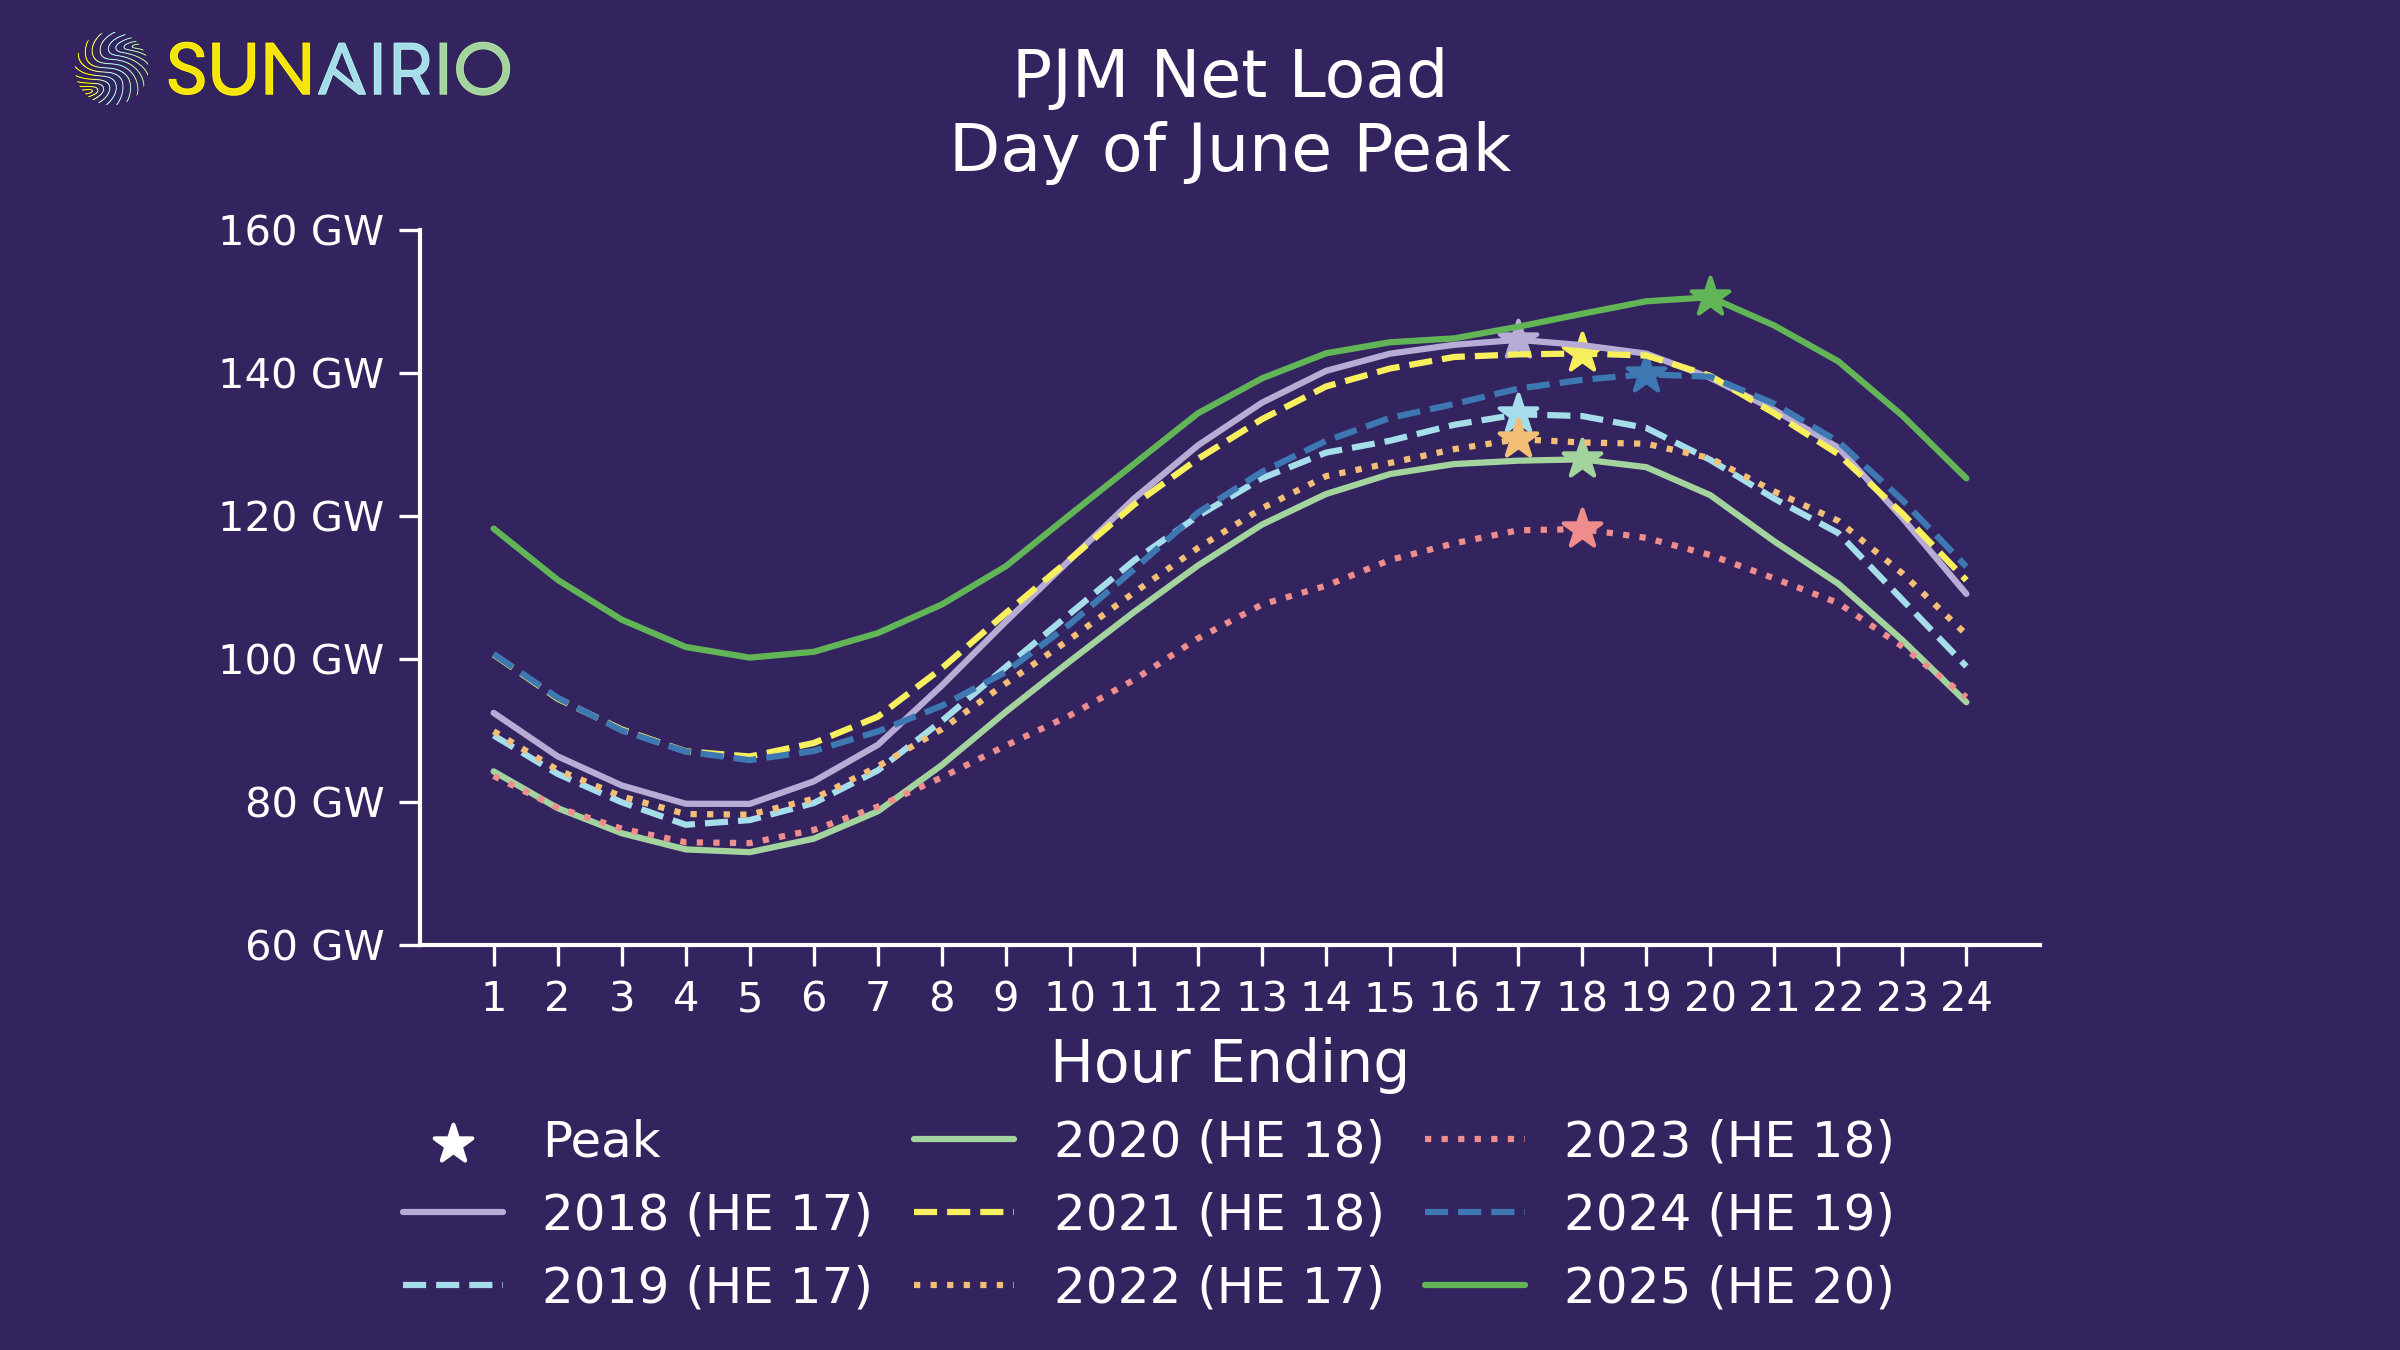
Peak net loads have been creeping later in the day for some time. The highest net load hour in June has shifted from HE 17 in 2018 and 2019 to HE 20 this year, as Figure 3 shows for each June’s highest net load day since 2018.
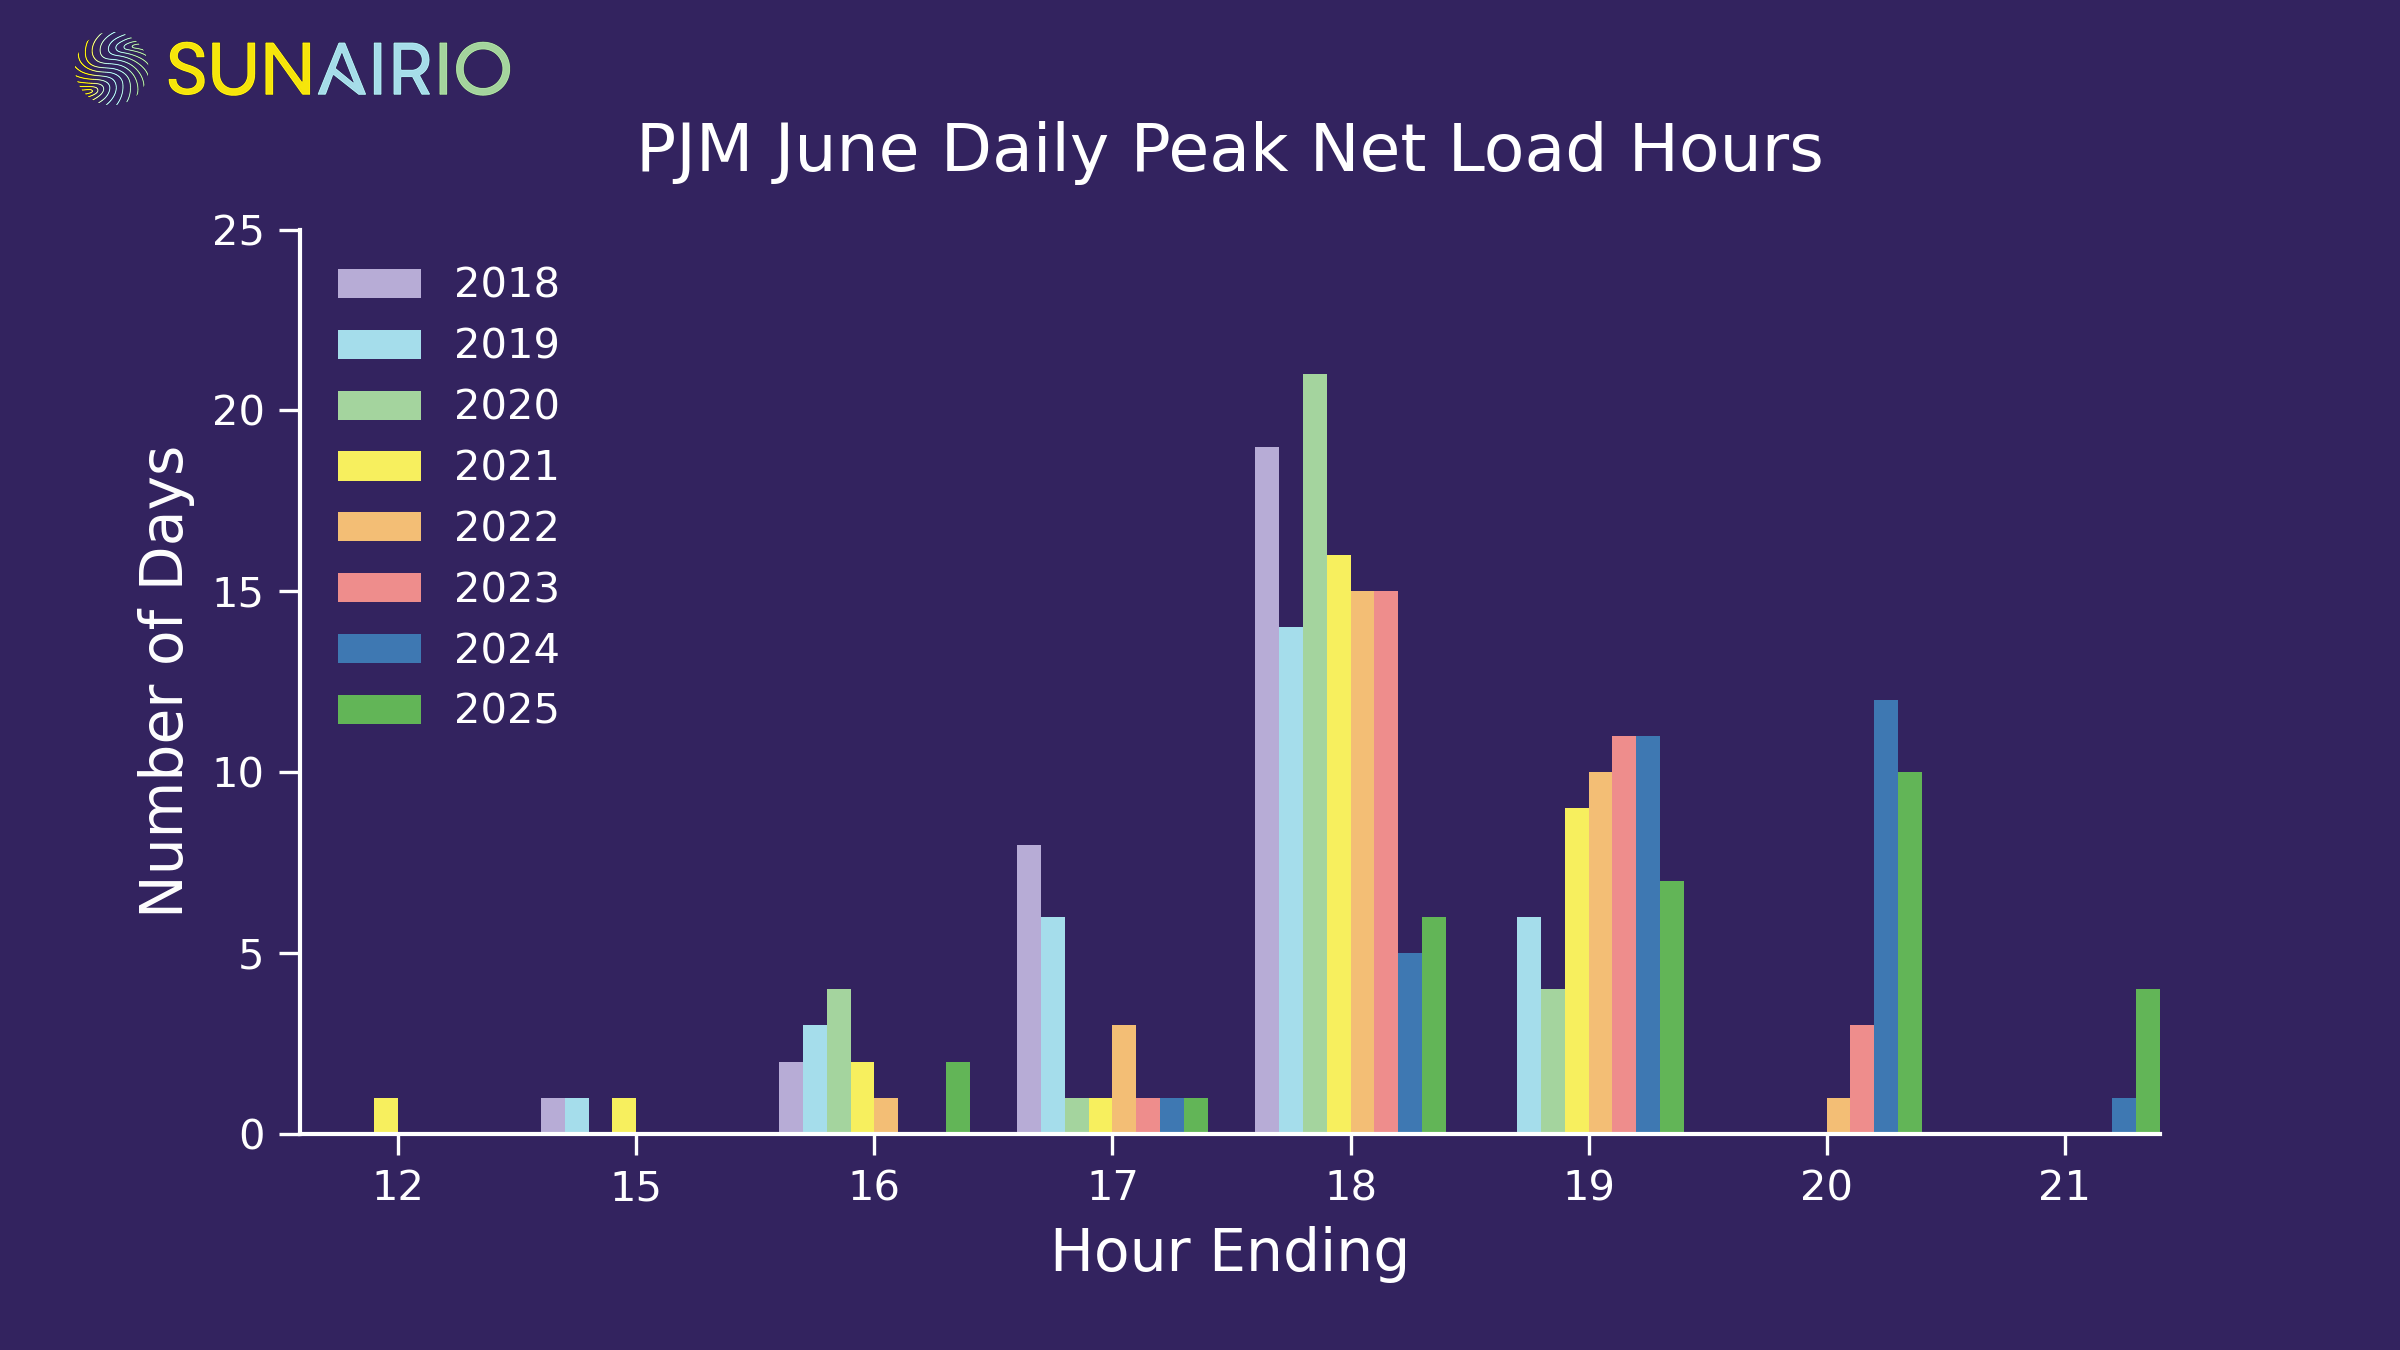
This pattern extends to less extreme days as well: 70% of daily net load peaks occurred at hour ending 19 or later in 2025 compared to 0% of peaks occurring that late in June 2018, as Figure 4 demonstrates across all June days since 2018.
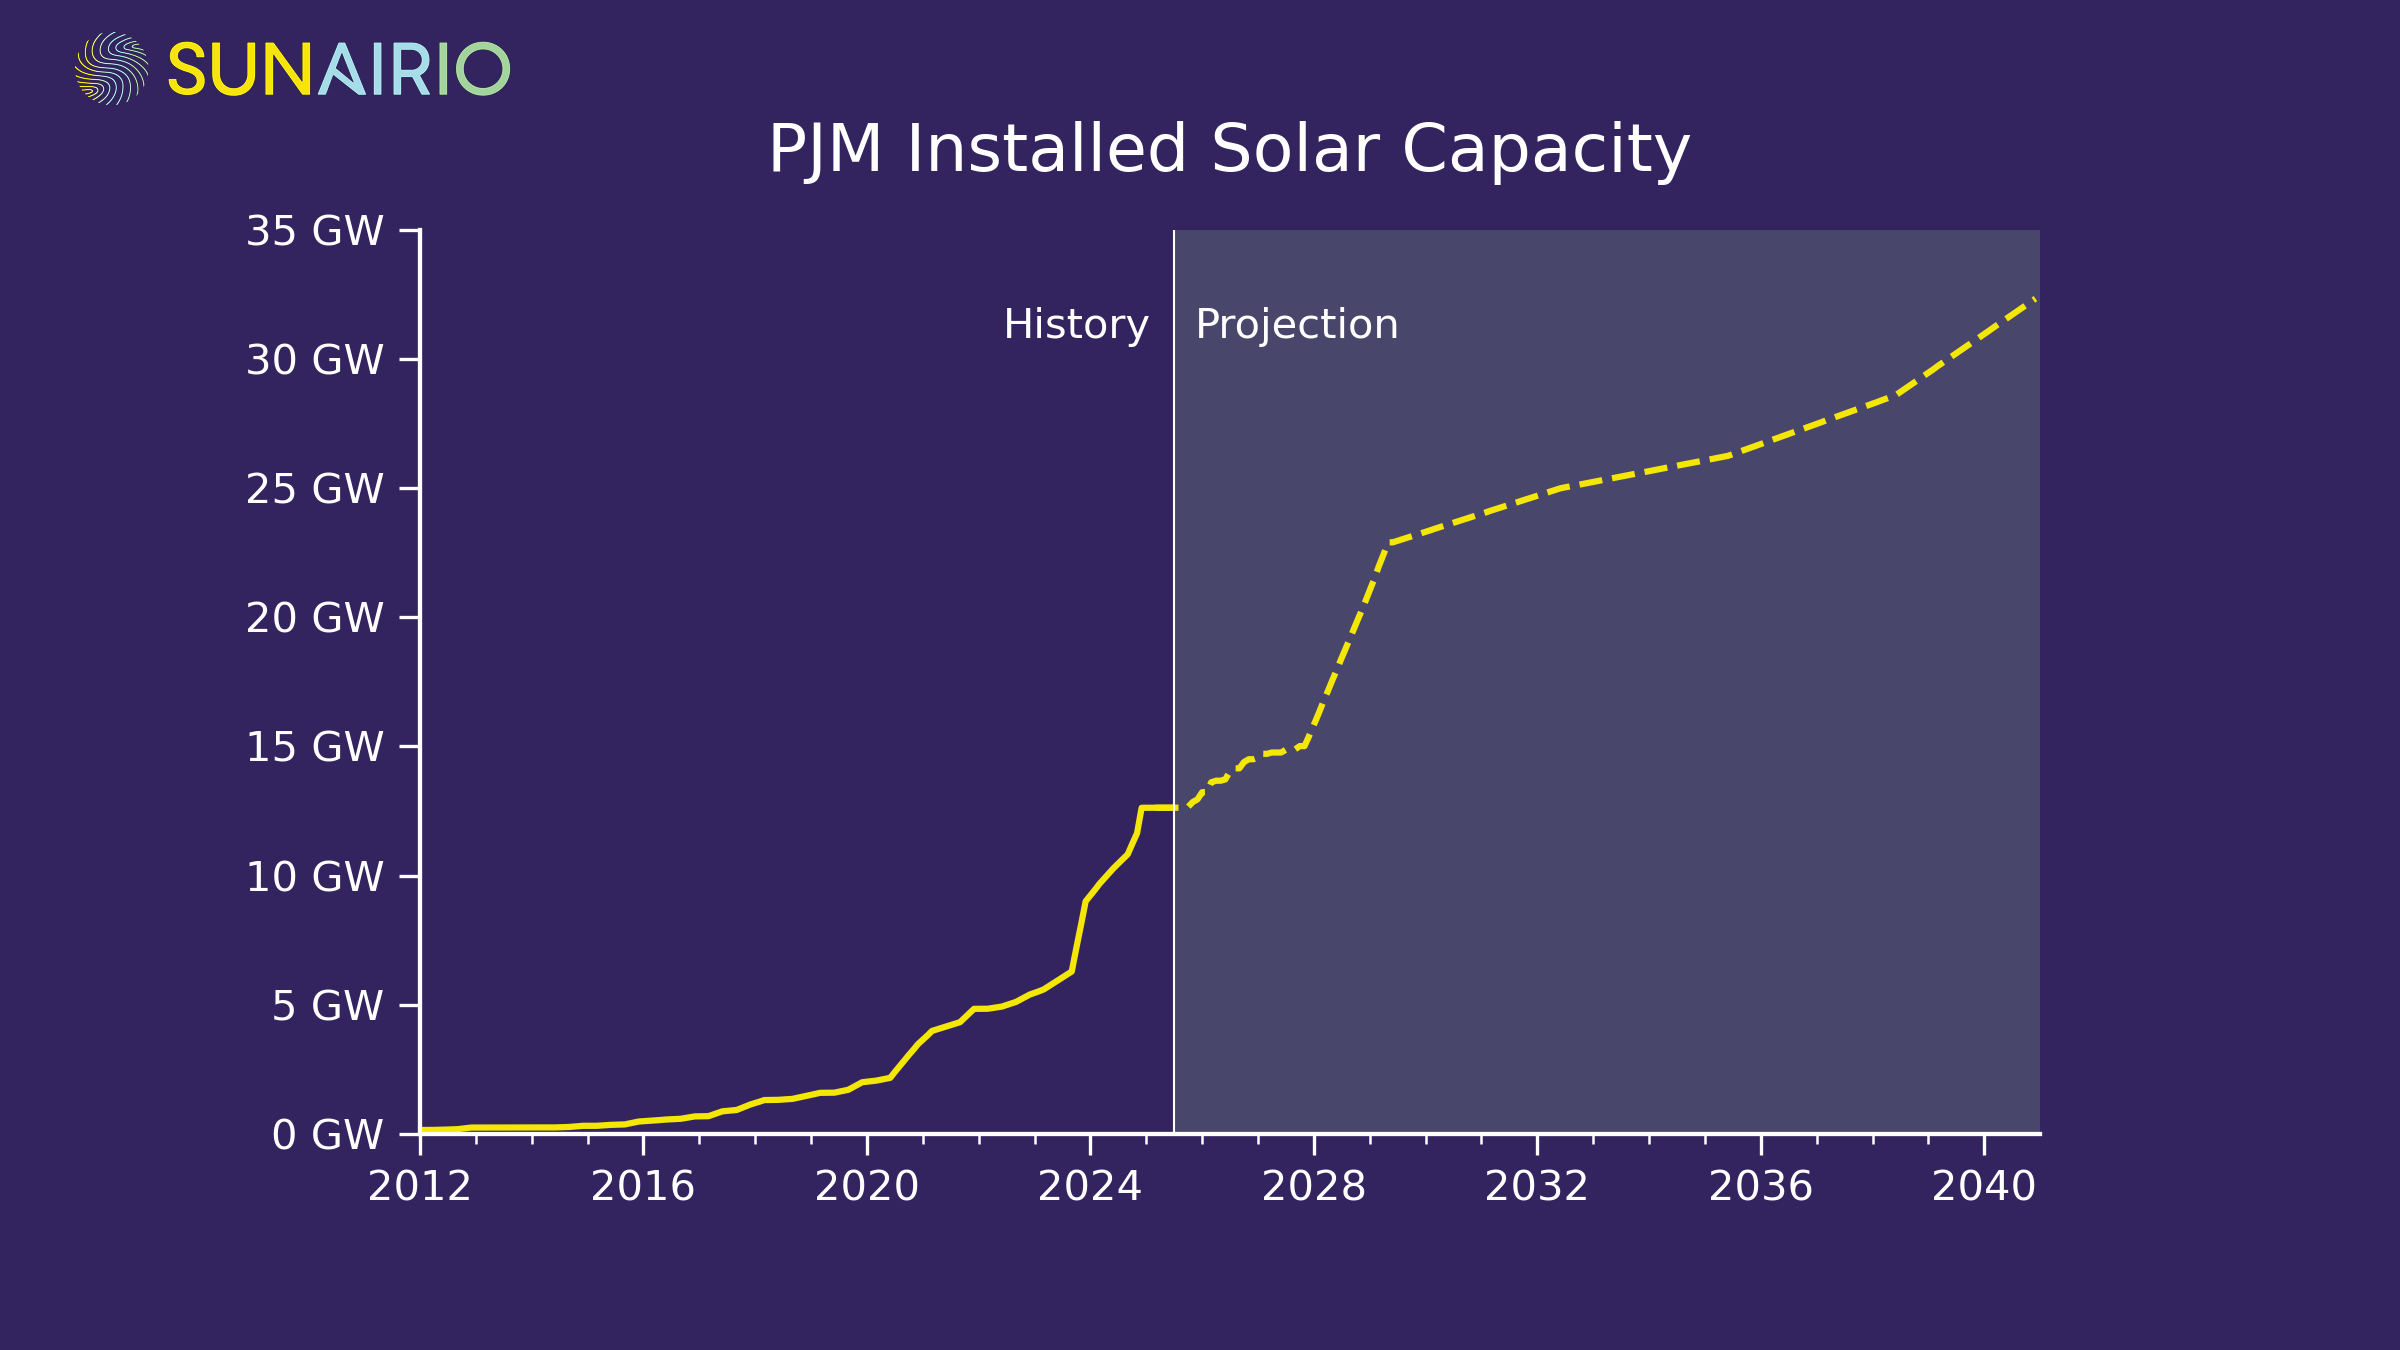
This intraday net load pattern shift mirrors the massive growth of installed solar capacity in PJM. Utility-scale solar capacity has increased roughly 500% since 2020, from 2 GW to more than 12 GW as of June 2025, as Figure 5 illustrates.
As solar penetration increases in PJM, it drives greater price volatility and concentrates the highest price risks later into the evening hours during summer months.
Fundamentally, it creates a grid management challenge as the quickly setting sun necessitates a steep ramp for other generators to be brought online. This highlights the need for accurate net demand (load, solar, and wind generation) forecasting and fast-ramping resources to successfully enable renewables integration.
Even with the headwinds that new solar projects face today, we still expect a sizable capacity addition over the next few years as projects that are under construction reach completion and the pipeline of projects that qualify for remaining tax incentives break ground.
The bottom line: add PJM to the list of power markets whose fundamental outcomes are increasingly controlled by the intraday volatility and intermittency of weather-driven generation resources.