
Sunairio High-resolution Earth Data
A foundational dataset powering our differentiated view of weather risk.
Overview
A foundational dataset
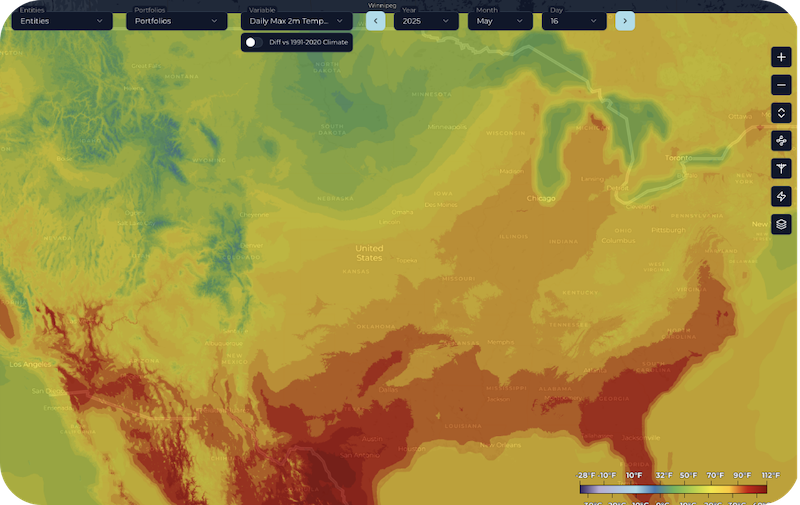
The SHED is Sunairio’s foundational dataset that powers our differentiated, granular view of weather risk. It’s a serially-complete, 3-km or finer spatial resolution, hourly or smaller time step weather data archive currently covering the continental US.
The SHED houses all the tools you need to investigate weather-based drivers of asset, portfolio, and regional variability. The SHED is available from 1950 to present and is updated hourly. More details concerning the underlying methodology are available here.
The SHED houses all the tools you need to investigate weather-based drivers of asset, portfolio, and regional variability. The SHED is available from 1950 to present and is updated hourly. More details concerning the underlying methodology are available here.
Flexible
Multiple formats
We store the SHED in hourly snapshot and full time series file formats to enable both spatial and temporal analyses.
It has never been easier to study the weather drivers and climate trends affecting energy production, portfolio revenues, and grid reliability.
It has never been easier to study the weather drivers and climate trends affecting energy production, portfolio revenues, and grid reliability.
Customizable
Weather variables and custom heights
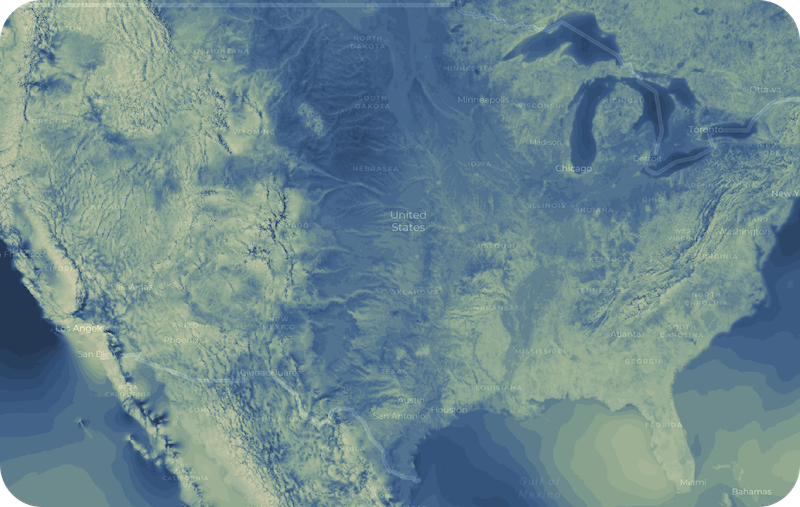
The SHED includes all weather variables necessary for modeling variable energy resources: MSLP, temperature, dew point, wind speed, wind direction, cloud cover, GHI, DNI, DHI.
Weather can be interpolated instantly to any height up to 300 meters above ground level.
Weather can be interpolated instantly to any height up to 300 meters above ground level.
Extension
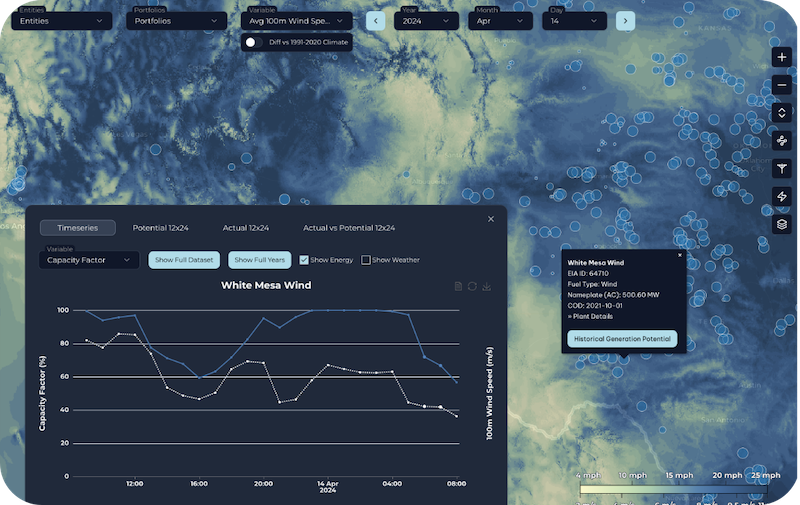
Historical Generation Potential
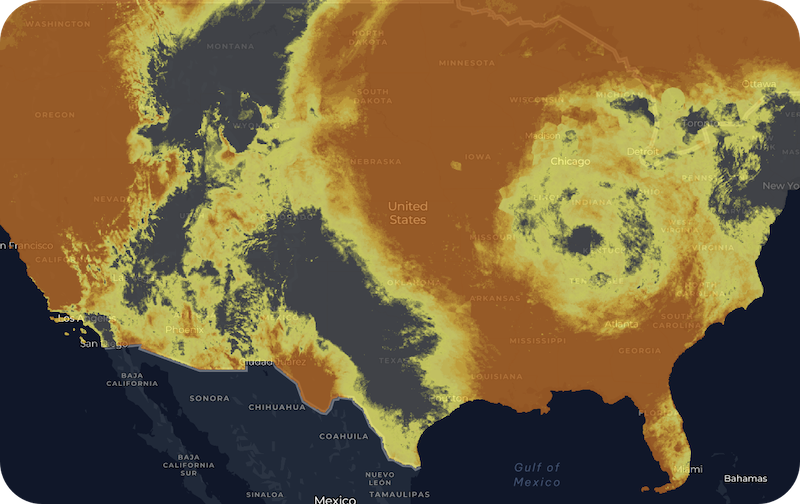
What happens when you combine high-resolution historical weather with the most sophisticated asset-level energy production models? You get a totally unique generation dataset: Sunairio Historical Generation Potential, an hourly archive of modeled, ideal hourly generation for all utility-scale wind and solar sites in the country (6,000+).
Calculate implied loss factors for any operating site by comparing Generation Potential against actual generation data from the EIA or ERCOT (included in the dataset).
Generation Potential is your window into the hourly operations of the entire utility-scale US wind and solar fleet.
Calculate implied loss factors for any operating site by comparing Generation Potential against actual generation data from the EIA or ERCOT (included in the dataset).
Generation Potential is your window into the hourly operations of the entire utility-scale US wind and solar fleet.
Want to access the SHED?
Views plans
Looking for forward-looking forecasts?
Learn about Sunairio ONE