Overview
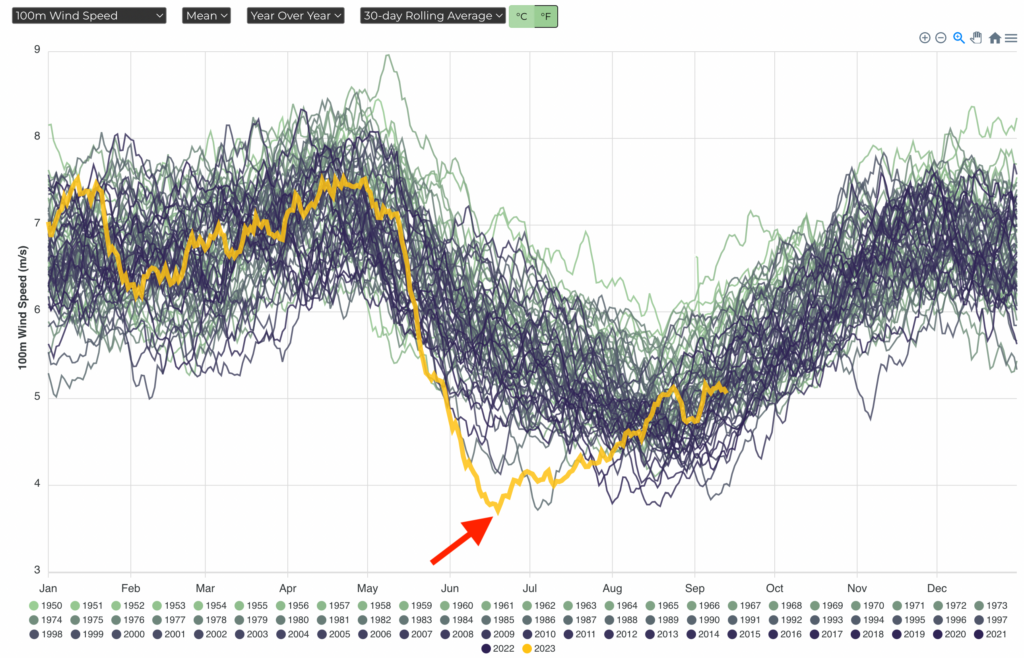
Average 100m wind speeds in parts of the U.S. Midwest were lower than ever during May through July of this year (based on ERA5 data from 1950 to the present). For example, the plot below displays 30-day average 100m wind speeds for Clay County, MO (just outside of Kansas City) with 2023 highlighted in yellow:

Besides causing significant wind energy production and revenue shortfalls, this record low-wind period has precipitated questions throughout the wind energy industry related to the role that climate change is playing, the likelihood of similar events happening in the future, and strategies to mitigate impact.
Let’s start by looking at the trends themselves.
Annual and Seasonal Trends in 100m Wind Speed
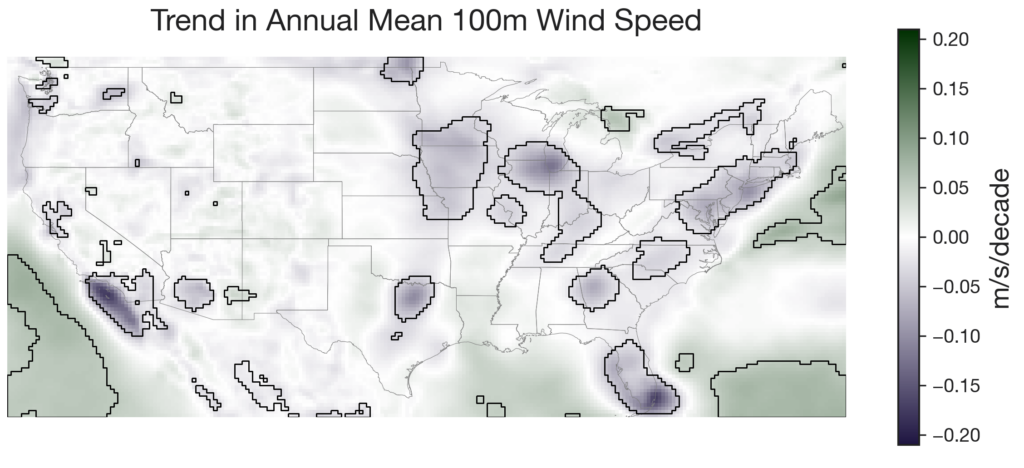
On an annual basis, average 100m wind speeds have been declining in much of the Eastern and Midwest U.S., including wind-rich onshore areas of IL, IA, KS, NE, and MN as well as wind-rich offshore areas off the coasts of NJ, NY, CT, and MA. The following map shows wind trends across the US, with regions of statistically significant (p < 0.01) trends bounded by a black border.

Annual trends, however, don’t reveal differences throughout the year. For example, here’s a map of wind trends for January and August:

Note the strong negative trends in August throughout the northern Midwest and East Coast (including offshore) which are either not present or much less pronounced in January. In these areas, in other words, not only is It getting less windy—it is getting significantly less windy in summer.
What’s causing this?
Climate Change Impacts
At Sunairio, we get versions of this question all the time. “Is this climate change?”, “Is this going to get worse?”
What we know is that global winds experienced a pronounced decline starting around the 1980s. This “global stilling” has been less intense since 2010, though wind speeds are still below pre-1979 averages. The Intergovernmental Panel on Climate Change forecasts slowing wind speeds through 2100–at which point they predict that annual average wind speeds could drop by 10%. Unfortunately, compared to the body of knowledge on global temperature trends, there’s not as much scientific consensus on the exact causes of trends in wind speed––though two major drivers are thought to be controlling: 1) changes in large-scale atmospheric circulation and 2) an increase in “surface roughness” (e.g. forest growth, urbanization).
To visualize what’s happening more precisely, we created an animation of the probability distribution of summer wind speeds for a county in Kansas relative to 1950-1979.
This animation helps convey an important point about the relationship between climate trends–which are usually described by changes in averages over time–and the likelihood of extremes: a small shift in the center of a weather probability distribution may cause a large change in extreme event frequency. As the animation progresses, note that the likelihood of extremely calm (low-wind) periods is much more pronounced than the relatively small shift left of the overall wind speed distribution.
The Difference in Wind Power Production
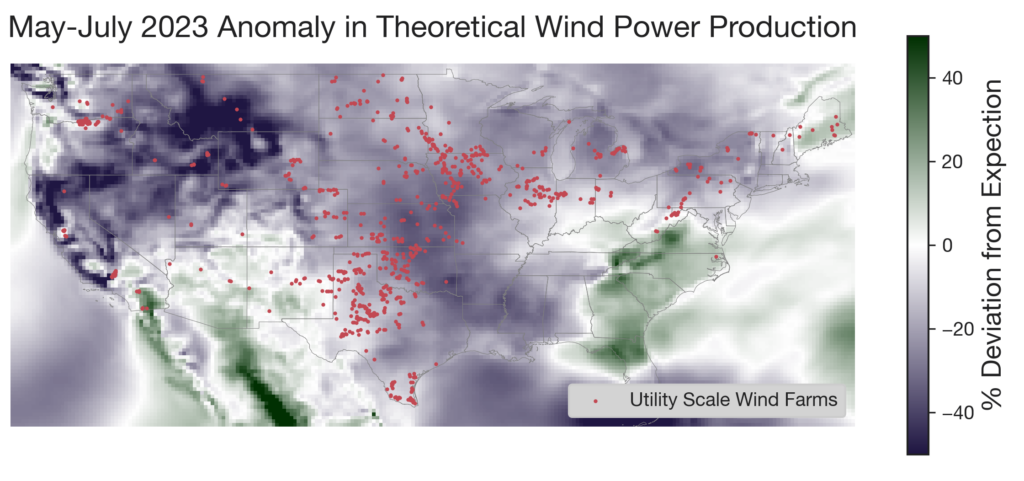
With some wind power curve assumptions we can calculate how much less wind power was produced than expected during May-July 2023. As we see in the figure below, many areas with high concentrations of wind farms saw production deficits of 20%-30% translating to approximately 17,000,000 MWh less wind energy production than expected throughout the U.S.

Note that this is 20%-30% lower than expected wind power production estimates which already account for the observable, negative trends in wind speed over time (meaning that current-year expectations should generally be lower than historical averages). If we calculated the drop in wind power against a simple historical average, the deficit would be even greater.
Financial Budgeting Implications
Wind power production expectations are typically the most critical input in financial budgets for utility-scale wind farm owners. Traditionally, renewable energy asset owners have set production and revenue budgets at what they consider to be median (or P50) levels based on a backward-looking analysis of historical weather.
In this context, an event such as the May-June 2023 period would be considered a loss (relative to budget)–and because the P50 expectations are usually not adjusted for climate trends, those losses would likely have been greater than the 20%-30% we estimated.
But even with budgets that account for declining wind speeds, asset owners face a second problem: how to anticipate production variability–i.e., the risk of a low wind or high wind periods. This variability is essential to estimate in order to ensure sufficient capital reserves to survive adverse events and anticipate the magnitude of cost-saving plans that might be necessary to hit annual profit targets. Traditionally, these variability assessments (also known as production risk assessments) have also been accomplished using history. As the May-July 2023 event shows, however, using a limited sample of historical wind speeds as a proxy for future wind speed risk–and not accounting for climate trends–does not work.
Grid Reliability Implications
Wind farm owners aren’t the only stakeholders who depend on wind power. Regional power grids increasingly rely on renewables for essential grid-balancing energy. Events such as the May-July 2023 low-wind period expose utilities and ISOs to significant risks because resource adequacy modeling uses historical weather data only, and this event was (by virtue of being a record) outside the modeled range of possibilities.
Luckily, regional power grids did not suffer reliability events during this period, likely due to a range of factors–the most significant being an additional 12.5 GW of solar capacity being installed year over year (including almost 4 GW in what the EIA classifies as the “West North Central”) and a relatively mild summer in the upper Midwest.
What Does Work: Stochastic Climate Simulation
For all the issues described above, Sunairio incorporates forward-looking climate modeling to assess renewable energy production risks. Our solution is stochastic in nature, easily scalable , and done at very high temporal (hourly) and spatial (3km or less) resolutions. When we simulate 1000 outcomes of a future time period, it’s like having access to 1000 probabilistic climate-aware possibilities.
With 1000 probabilistic outcomes of current and future-year wind speed, we can accurately quantify expected (or median/P50) wind production, and risks to that production, much more accurately (at least 4x more accurately) than is possible using historical data alone. Moreover, we can predict the likelihood of extreme weather events happening–even those that are statistically possible but not in the historical record (yet).
For example, our simulations show that the May-July 2023 event should occur at a frequency of about 1 in 83 years. Perhaps even more relevant: any 3-month period (not just May-July) with an equivalent wind production capacity deficit will occur roughly 1 in every 10 years. These are extreme events–but they will occur again, and they shouldn’t be considered unknowable risks.
Conclusion
North American wind speeds are declining in some of the most wind-rich areas–where a significant amount of wind energy capacity is either already or soon to be installed.
When future wind speed expectations are tied to historical averages and historical ranges as part of long-range planning exercises, these wind energy production estimates will eventually be wrong.
A robust solution to this problem is to use forward-looking climate simulation for wind energy production risk assessment.