
Overview
What’s the best way to model power market dynamics that drive energy prices?
In this blog post, we review traditional models via generation stacks, introduce a Dispatchable Capacity Utilization (“DCU”) model as a way to modernize traditional approaches for renewable growth and contemporary market realities, and finally show how Sunairio’s proprietary Grid Stress IndexTM version of the DCU model performs by comparing actual summer 2024 electricity prices in Texas (ERCOT) to pre-season electricity price estimates generated using Sunairio’s Grid Stress IndexTM DCU model.
The Traditional Approach: Grid Dispatch and the Generation Stack
Regional power grids are in balance between supply (generation and imports) and demand (customer load and exports). To minimize unnecessary costs, regional grid operators continually dispatch the least-cost mix of generation that meets demand while accounting for both physical constraints (e.g. transmission line capacity) and techno-economic constraints (e.g. minimum unit run times, minimum reserve requirements).
Reflecting this least-cost mandate, regional energy prices are traditionally modeled via an idealized generation stack supply curve that assumes that all resources are dispatchable and ignores congestion and losses.
In Figure 1, for example, a demand of 4,000 MW would correspond to a least-cost generation mix that first dispatches all wind, solar, and hydrothermal generation and then dispatches a portion of combined-cycle gas generation. The marginal energy price would correspond to the marginal cost of combined-cycle gas generation ($25).1

Figure 1. Hypothetical generation supply curve by plant type
This traditional model was developed at a time when most power generation resources were generally assumed to be available 24x7 because traditional thermal generators (nuclear, coal, gas, oil) are inherently dispatchable. Unfortunately, not all generation resources are dispatchable and actual plant capacity varies at any point in time. Power plants have outages and maintenance; wind and solar generation potential is weather-dependent. The widths of the blocks in Figure 1 (and thus the capacity vs price relationship) is constantly in flux.
A Modern Approach to Modeling the Power Grid Supply/Demand Balance: The Dispatchable Capacity Utilization Model
To modernize the traditional formulation of price as a function of demand, we first remove non-dispatchable renewables from the supply curve and instead net them against demand. The resulting measure of effective demand, net demand, is then the amount of energy that needs to be met with dispatchable capacity.
Net demand = Demand - (Non-dispatchable Renewables)
To normalize across periods with different demand levels and available capacity, we then transition from raw energy space to percentage space. A net demand of 7,000 MW when the grid has 10,000 MW of dispatchable capacity, for example, is modeled as 70% utilization of dispatchable resources.
Net Demand / Dispatchable Capacity
Next, we adjust the dispatchable capacity by the amount of generation outages to yield available dispatchable capacity, giving us
Net Demand / Available Dispatchable Capacity
or
Dispatchable Capacity Utilization = (Demand - (Non-dispatchable Renewables)) / (Dispatchable Capacity - Outages)
which is a single metric ranging from 0% to 100%, that describes the utilization of the power grid.
Finally, we map this metric to delivered spark spread prices instead of raw marginal prices, which normalizes for the effect of changing fuel prices. We assume a standard heat rate of 6.5 MMBtu / MWh
Spark Spread = LMP - Heat Rate * Delivered Gas Price
The Relationship Between Dispatchable Capacity Utilization and Market Prices
Moving from theory to practice, Figure 2 plots delivered spark spreads as a function of GSI or just DCU for all hours June-August 2023.
The relationship looks very similar to the idealized marginal supply curve (Figure 1). We can clearly see a slow rise in marginal cost followed by an inflection point around 75% available dispatchable capacity utilization, after which prices rise swiftly. Interestingly, the extremes of this plot are higher than those modeled by the traditional approach, as prices are often well above physical fuel costs (reflecting scarcity-seeking behavior from market participants). Putting this together, we’ve effectively learned the true ERCOT marginal supply curve without actually modeling the individual unit generation stack.
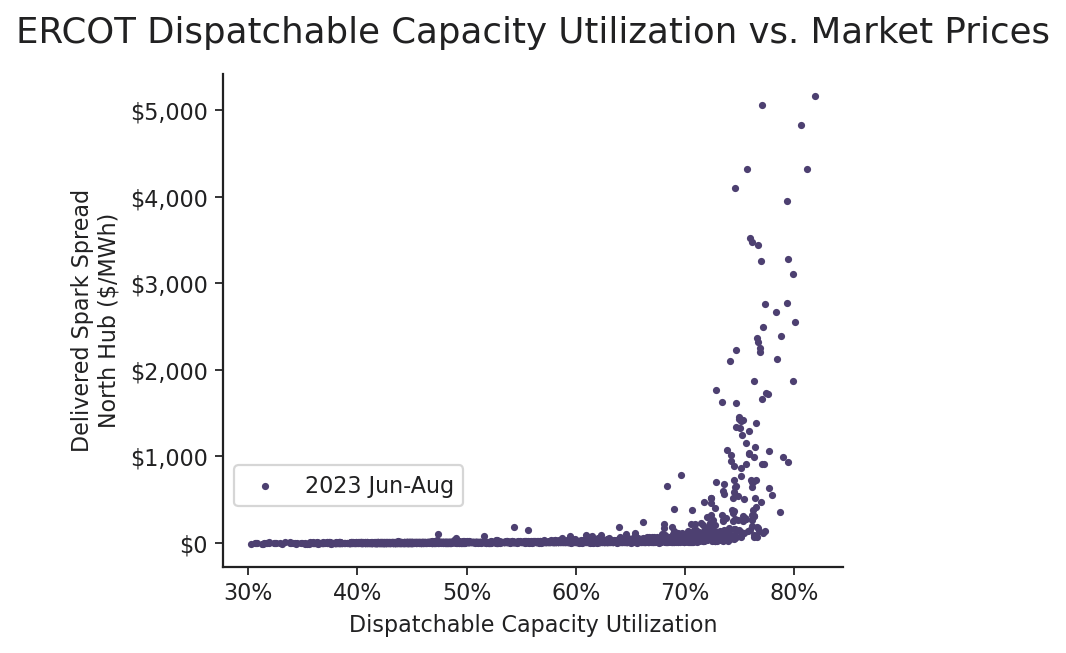
Figure 2. ERCOT dispatchable capacity utilization vs spark spread.
Using the Sunairio Ensemble to Forecast Dispatchable Capacity Utilization
Now that we’ve established the fundamental relationship between dispatchable capacity utilization and energy prices, we note that realistic simulation of this measure requires correctly producing inputs that are probabilistic (replicating extreme events at the correct likelihood) and fully correlated (replicating the correct joint distribution of load, renewables, and generation outages). As the Sunairio ensemble is purpose-built for this task, our forward-looking Grid Stress IndexTM DCU model can provide a highly realistic forecast of regional power grid stress.
For example, in order to present an up-to-date view of supply and demand resources, we update installed capacity projections monthly and retrain/re-forecast energy models hourly.
As we can see from Table 1, there are currently significant trends in both installed generation capacity and demand, making the downstream effect on the hourly dispatchable capacity utilization complicated to anticipate.
| Installed Capacity | 2023 Jun-Aug | 2024 Jun-Aug | Change |
|---|---|---|---|
| Wind | 37.7 GW | 39.6 GW | +1.9 GW |
| Solar | 16.6 GW | 27.1 GW | +10.5 GW |
| Non-renewable | 89.2 GW | 90.3 GW | +1.1 GW |
| Battery | 2.6 GW | 7.2 GW | +4.6 GW |
| Average Load Growth | +7% |
Table 1. Generation capacity and load growth trends, ERCOT 2024 vs 2023
What Did Sunairio Say About ERCOT Summer 2024 Grid Risks?
To benchmark Sunairio ERCOT simulations against historical realizations, we compared our pre-summer simulated distribution of Grid Stress Index to the actual distribution from June through August 2024. 2
Figure 3 (left) presents the distribution of forward-looking Sunairio simulations from May 3, 2024 (blue line) against actual distribution (green histogram). The fit is quite close, implying that Sunairio GSI forecasts from early May accurately reflected the various risks to the hourly Grid Stress Index (alternatively, one can interpret this fit as an indication that ERCOT June-August 2024 hourly grid balances were distributed close to expectations).

Figure 3. Forecasted and Actual ERCOT hourly Grid Stress Index distribution, June through
August 2024.(Left) Actual 2023 and 2024 ERCOT hourly Grid Stress Index distribution(right).
Comparing the 2023 and 2024 historical distributions of the Grid Stress Index (Figure 3, right),
we see that the ERCOT market was much tighter in 2023 than in 2024. In particular, 2024, had
far fewer hours in the high-priced regime above 75% available dispatchable generation
utilization–a shift that we see ultimately reflected in realized prices too (Figure 4):

Figure 4. Hourly North Hub delivered spark spreads as a function of the Grid Stress Index, June-August 2023 and 2024.
| North Hub Delivered Spark Spread (6.5HR) | 2023 Jun-Aug Actual | 2024 Jun-Aug 5/3/24 Market | 2024 Jun-Aug Actual | 2024 Actual vs 5/3/24 Market | 2024 Actual vs 2023 Actual |
|---|---|---|---|---|---|
| Peak ($/MWh) | $153.63 | $112.85 | $29.00 | -$83.85 | -$124.63 |
| Off-peak ($/MWh) | $27.09 | $45.06 | $14.95 | -$30.11 | -$12.13 |
| 7x24 ($/MWh) | $86.69 | $76.79 | $21.47 | -$55.32 | -$65.22 |
Table 2. Realized and forward market (on 5/3/24) spark spreads
Looking at Table 2, we note that 2024 realized prices were not only much lower than their 2023 counterparts but also much lower than pre-season market forward prices. Sunairio pre-season ERCOT forecasts at that time, however, were much closer. In other words, Sunairio forecasts are excellent predictors of 1-3 month-forward grid balances and are also effective market signals of significant downside to energy prices relative to the same period from 2023.
Conclusions
Sunairio and Grid Stress Index are the trademarks of Sunairio, Inc.