For plants, spring is a season of growth. But for power market participants and grid operators, it’s a time of surprises and volatility.
While typically mild spring weather results in low expected grid demand, extreme spring weather — through a confluence of factors — can drive real-world hourly grid balances to levels that approach or exceed emergency conditions. This contrast between mostly moderate days and acute periods of serious grid stress makes spring just as challenging to navigate as the traditional “peak” seasons in summer and winter.
Properly anticipating this inherently stochastic risk requires both a nuanced understanding of the underlying fundamentals and a probabilistic framework to quantify low-probability but high-impact economic and reliability outcomes. In this blog post, we examine actual weather, grid, and market events from this spring in ERCOT within a probabilistic context. Looking ahead to spring 2026, we then explore how rapidly changing grid fundamentals may alter next year’s spring grid risk profile.
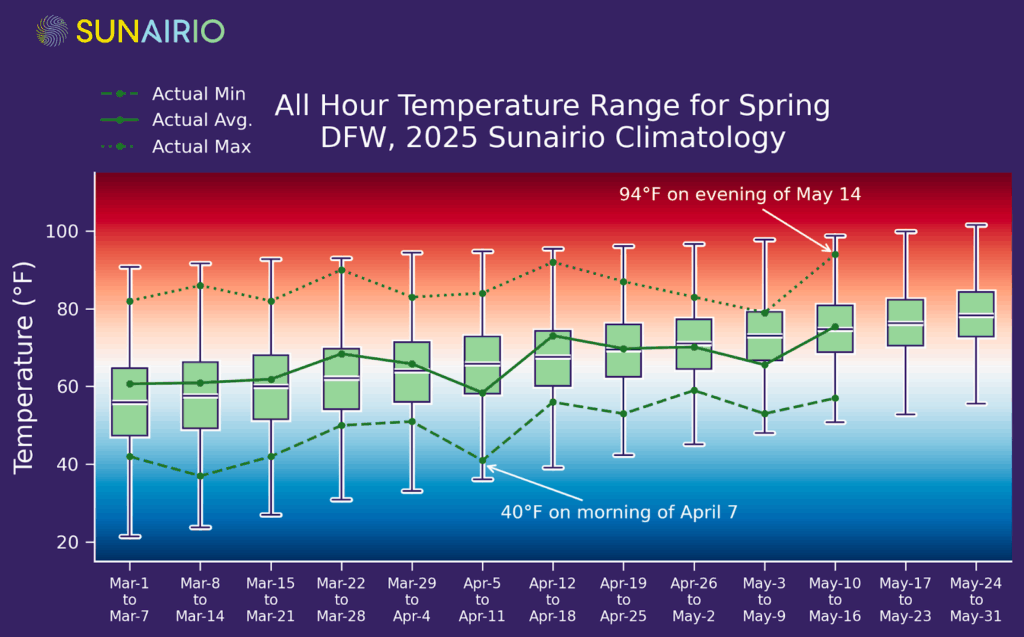
This year has not been an exception to the rule that spring weather varies wildly. Temperatures on April 7 dropped to 40ºF at DFW and into the 30s around Dallas (colder than all of March) while an early season heat wave drove forecast highs over 100ºF last week (levels not typically seen until July).
Figure 1 plots this spring’s weekly average, minimum, and maximum temperatures (green lines) against ranges derived from Sunairio probabilistic climatology (box and whisker plots) at DFW. As the plot shows, most hourly temperatures throughout spring are relatively mild — between 50ºF and 70ºF — but extremes dip into freezing territory and extend into severe heat.
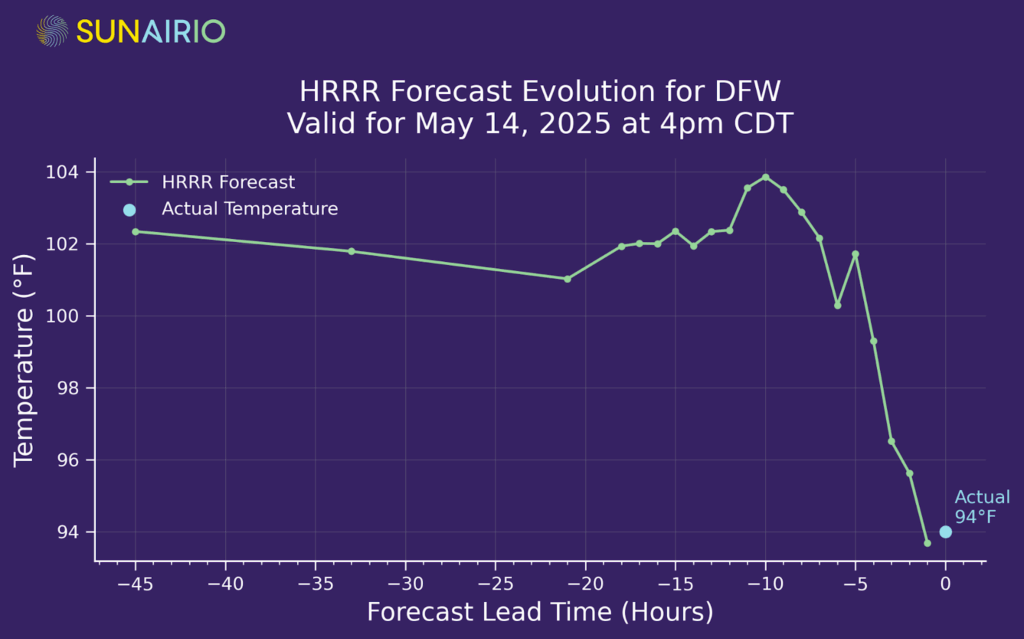
Temperatures could have been even more extreme this year if the weather forecasts for the May 12 week hadn’t flopped. As we see in Figure 2, the forecast for the May 14 afternoon high at DFW was 102ºF just 12 hours out — yet realized 8 degrees lower at 94ºF. That 8-degree temperature forecast error likely reduced ERCOT RTO load by approximately 9 GW versus higher temp load expectations, leading to a $40 Day-ahead/Real-time spread (DA higher than RT) — highlighting the difficulties of navigating grids amid temperature variability and forecast uncertainty.
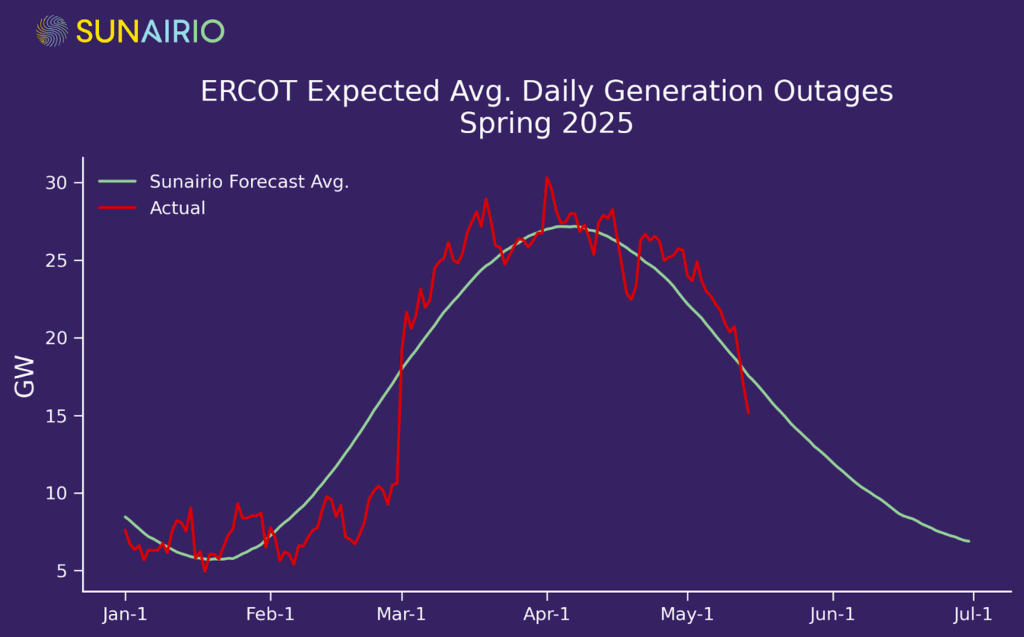
In spring, dispatchable resources are often not available on purpose. Given that the majority of Texas spring weather is mild and that the season immediately precedes the peak demand summer months, generators schedule the bulk of their maintenance outages during this time. As we see in Figure 3, nonrenewable (thermal) generation outages usually peak in early April (coinciding with the mildest expected temperatures and lowest expected load), though unscheduled outages can cause significant variability. Ironically, such high levels of dispatchable unit outages can tip the grid from normal conditions into capacity shortfalls. Scheduling generation outages in spring makes sense, until it doesn’t.
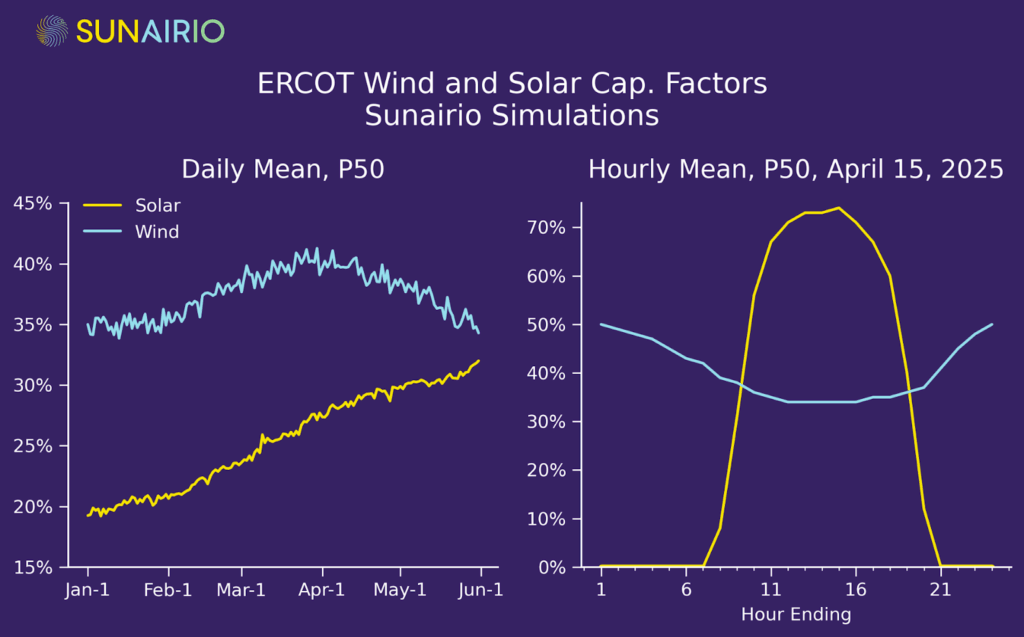
Temperatures and unit outages aren’t the only thing rising in ERCOT during spring. Wind generation typically maxes out in early April and solar generation typically increases by 38% from March 1 to May 31. Further complicating grid dynamics are intraday generation patterns, where wind generation peaks overnight and solar generation is dictated by the diurnal sunup-to-sundown cadence. Figure 4 plots both these seasonal (left panel) and intraday (right panel) trends.
Understanding grid risk these days is much more than understanding a simple temperature -> load relationship. It’s a multidimensional puzzle whose solution is driven by correlated variability between load, wind generation, solar generation, and the availability of dispatchable resources. It’s sensitive to temperature extremes, shifts in renewable generation patterns, and unit outages.
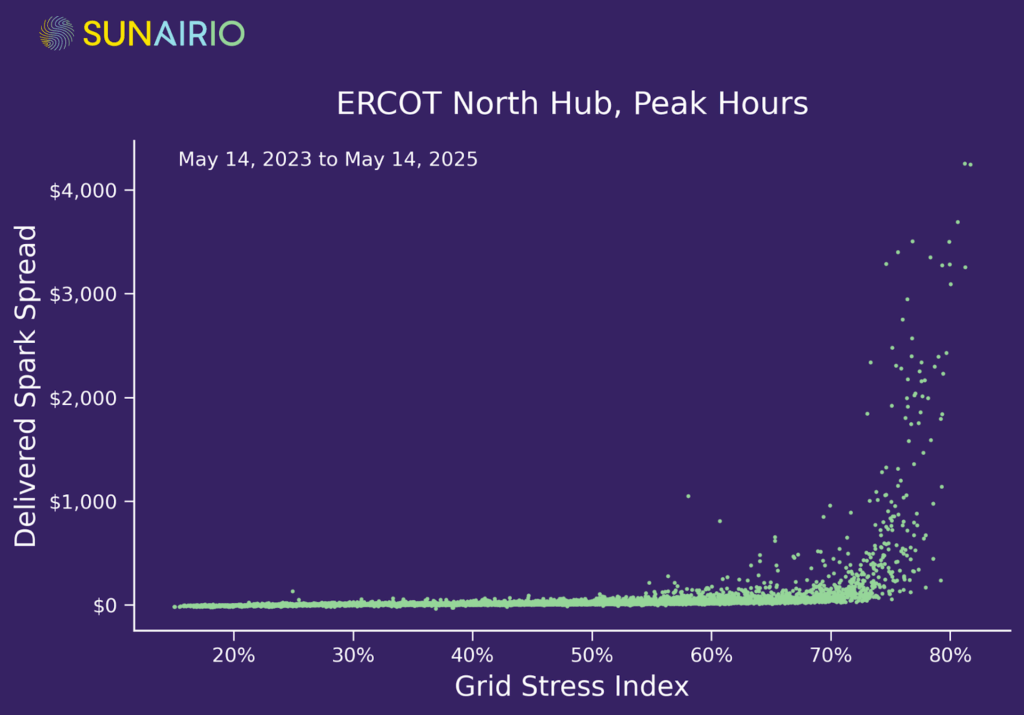
At Sunairio, we combine these fundamentals into one metric that provides a reliable indicator of overall grid stress — the Grid Stress Index (GSI), which measures the ratio of Net Demand (load minus renewables) to Available Dispatchable Capacity (read more about the construction of GSI here).
As Figure 5 shows, this metric anticipates hourly price volatility, with conditions in ERCOT (measured by delivered spark spreads) being relatively tame until GSI surpasses 60% — and becoming extremely volatile as GSI rises above 70%.
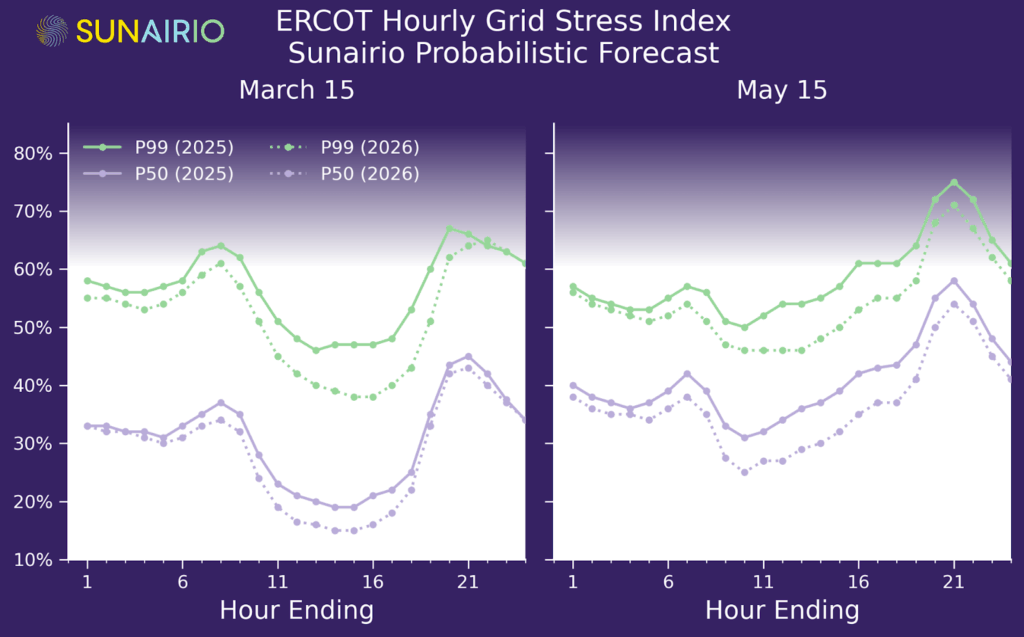
To understand grid risks on spring days, we use Sunairio’s historical simulations in Figure 6 to plot expected (P50) and extreme (P99) hourly GSI in both early (March 15) and late (May 15) spring 2025. For clarity, we shade the background darker above GSI = 60% to reflect increasing price risk. As the plot shows, while the majority of hourly conditions in spring fall below the 60% level corresponding to high prices/capacity shortages, extremes in several hours present significant risks.
In particular, cold mornings and low renewables can drive hours ending (HE) 7–9 to the danger zone in early spring (left panel, Figure 6), while afternoon heat and decreasing solar in the evening drives HE 20–22 even further beyond in late spring (right panel, Figure 6).

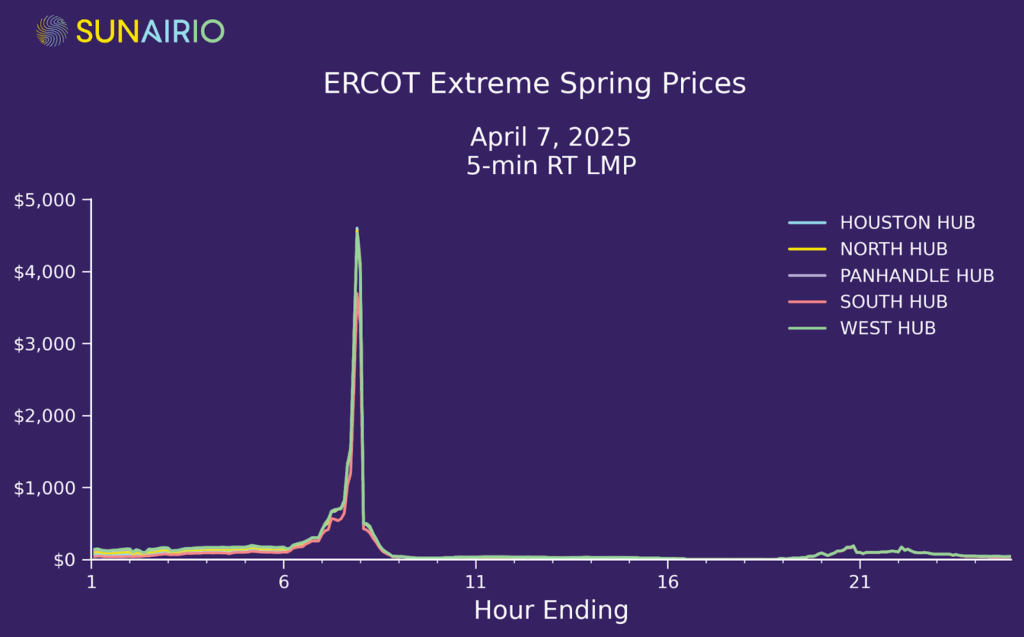
Indeed, on the exceptionally cold early spring ERCOT morning this year (April 7), we saw prices spiking close to the price cap in ERCOT and averaging $1,552/MWh in an hour (Figure 7) due to high GSI resulting from exactly this combination of low temperatures (dipping into the 30ºFs surrounding Dallas, low renewables (minimal solar at HE7), and high generation outages (25+ GW).
That one hour on April 7 added approximately $4/MWh to the monthly peak price, meaning that just 0.2% of hours in the April peak contract (1/352) accounted for 10% of the entire contract value.
With the spring drama almost behind us for 2025, what should we expect next year? Accounting for load growth and new unit additions/retirements, we find that conditions should generally be calmer next year across all spring hours. In other words, generation additions will outpace load growth — though the risk of acute price spikes remains, especially in the evening. As Figure 8 shows, P50 and P99 hourly GSI in both early spring (March 15) and late spring (May 15) are expected to be lower in 2026 compared to 2025, representing downside risk to ERCOT market prices.
Spring volatility highlights the challenges of managing grid and energy markets risk without a robust framework for evaluating the jointly correlated, multidimensional, granular, and skewed nature of the electric grids. To effectively navigate this period, grid planners and energy traders need to understand the complicated interplay between averages and extremes — to expect not just the seasonal trends but also to expect extreme events that drastically alter reliability and economic outcomes. It’s not enough to know that ERCOT grid balances for HE 7 typically don’t present much of a risk. We need to quantify the risk — via, for example, stochastic simulations — that weather and grid conditions conspire to drive capacity reserves low and market prices to the moon (as they did during HE 7 on April 7, 2025).